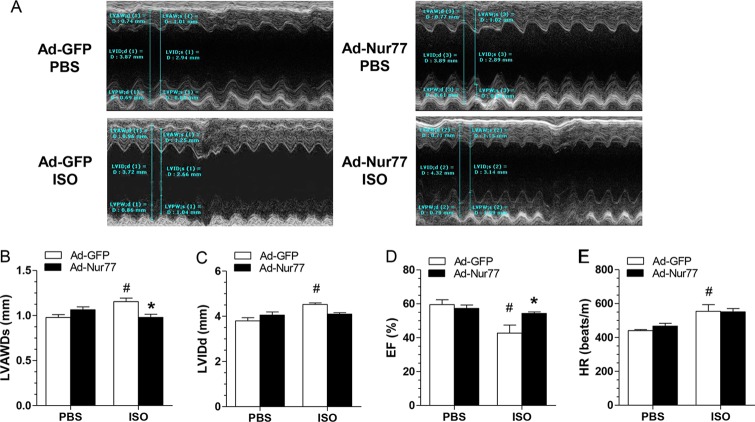
FIG 8.
Cardiac function was measured by echocardiography at 2 weeks after ISO pump infusion. (A) Representative echocardiograph from the various groups. (B and C) The left ventricle systolic anterior wall depth (LVAWDs) (B) and the LV internal diameters of diastole (LVIDd) (C) were measured at the view of the short axis from M mode. (D and E) LV ejection fraction (D) and heart rate (HR) (E) were calculated using VisualSonic analysis software (n = 5 animals/group). *, P < 0.05 versus Ad-GFP-ISO; #, P < 0.05 versus Ad-GFP-PBS.

