FIG 5.
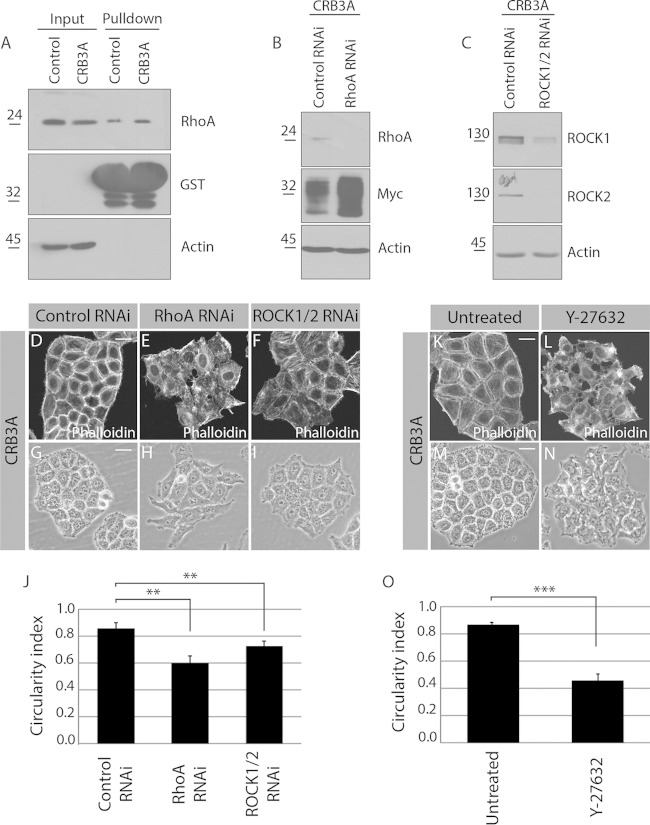
RhoA and ROCK1/2 are required for the CRB3A-induced reorganization of the cytoskeleton. (A) Control HeLa cells and Myc-CRB3A-expressing HeLa cells were homogenized. A portion of each homogenate was kept to monitor RhoA expression levels (input), and GST-rhotekin-RBD was used to pull down active RhoA, which was detected by Western blotting. Western blotting also controlled the amount of GST-rhotekin-RBD used in each experiment. Expression of Myc-CRB3A is associated with a 25% increase in RhoA activation (n = 3). (B and C) Western blots validating the knockdown of RhoA (RhoA RNAi) or ROCK1 and ROCK2 (ROCK1/2 RNAi). Actin was used as a loading control. (D to F) Phalloidin was used to stain F-actin in Myc-CRB3A-expressing HeLa cells knocked down for RhoA (RhoA RNAi) or ROCK1 and ROCK2 (ROCK1/2 RNAi). A scrambled siRNA was used as a control (control RNAi). (G to I) Phase-contrast images of Myc-CRB3A-expressing HeLa cells transfected with a scrambled siRNA (control RNAi), an siRNA targeting RhoA (RhoA RNAi), or siRNAs targeting ROCK1 and ROCK2 (ROCK1/2 RNAi). The circularity indexes of the colonies formed by these cells are shown in the histogram depicted in panel J. Bars represent means ± standard deviations (**, P < 0.01). (K and L) Staining of F-actin using phalloidin in Myc-CRB3A-expressing HeLa cells incubated with or without the ROCK1/2 inhibitor Y-27632. (M and N) Phase-contrast images of Myc-CRB3A-expressing HeLa cells treated or not with the ROCK1/2 inhibitor Y-27632. (O) Histogram showing the circularity indexes of Myc-CRB3A-expressing HeLa cells incubated with or without the ROCK1/2 inhibitor Y-27632. Bars represent means ± standard deviations (***, P < 0.001). Scale bars, 20 μm (D and K) and 30 μm (G and M).

