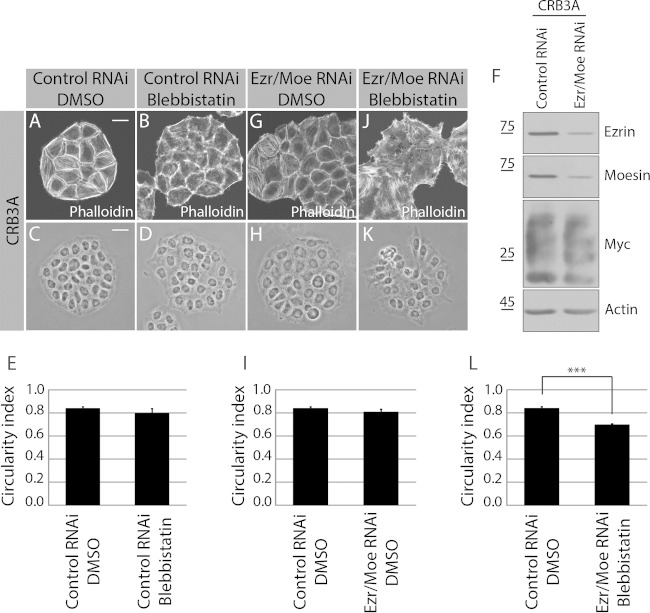
FIG 7.
Combined inhibition of myosin II and depletion of ezrin and moesin suppress the CRB3A-induced phenotypes. (A and B) Phalloidin was used to stain F-actin in Myc-CRB3A-expressing HeLa cells transfected with a control RNAi and incubated with DMSO or with the myosin II inhibitor blebbistatin. (C and D) Phase-contrast images of Myc-CRB3A-expressing HeLa cells transfected with a scrambled siRNA (control RNAi) and treated or not with the myosin II inhibitor blebbistatin. The circularity indexes of the colonies formed by these cells are reported in the histogram shown in panel E. (F) Western blot validating the knockdown of ezrin and moesin. (G) F-actin staining using phalloidin in Myc-CRB3A-expressing cells depleted of ezrin and moesin (Ezr/Moe RNAi). (H) Phase-contrast images of Myc-CRB3A-expressing HeLa cells knocked down for ezrin and moesin (Ezr/Moe RNAi). (I) Histogram showing the circularity index of Myc-CRB3A-expressing HeLa cells transfected with a scrambled siRNA (control RNAi) or an siRNA targeting ezrin and an siRNA targeting moesin (Ezr/Moe RNAi). (J) F-actin staining (phalloidin) in Myc-CRB3A-expressing HeLa cells treated with blebbistatin and depleted of ezrin and moesin. (K) Phase-contrast image of Myc-CRB3A-expressing HeLa cells treated with blebbistatin and knocked down for ezrin and moesin. The circularity indexes of colonies formed by these cells are shown in panel L. Bars represent means ± standard deviations (***, P < 0.001). Scale bars, 20 μm (A) and 30 μm (C).

