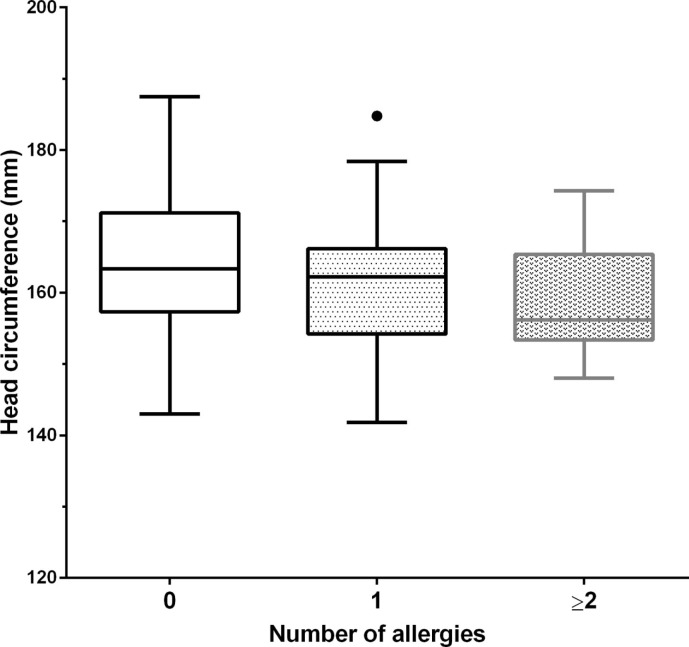
Figure 2.
Head circumference at mid-gestation vs. number of childhood allergies. Tukey boxplot, whereby “∙” represents a data point greater than the 75th percentile plus 1.5 times the interquartile range. 0 allergies (N = 80), 1 allergy (N = 30), ≥2 allergies (N = 11). An inverse relationship was observed between mid-gestation head circumference and the number of childhood allergies (p = 0.033).

