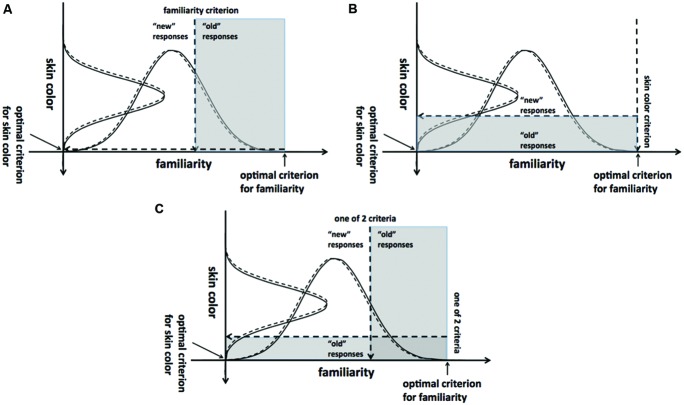
FIGURE 9.
Illustration of decision making in Experiment 3, study-free security patrol, from a multidimensional signal detection theory perspective. Dashed lines represent noise distributions; solid lines represent signal distributions. (A) Test probes are called “suspicious” if their familiarity exceeds a criterial level. (B) Test probes are called “suspicious” if the darkness of their skin exceeds a criterial level. (C) Either familiarity or skin color may be used to make judgments.

