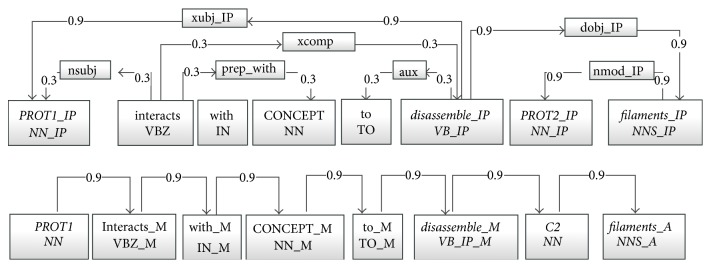
Figure 3.

Graph representation generated from an example sentence. The candidate interaction pair is marked as PROT1 and PROT2; the third protein is marked as PROT. The shortest path between the proteins is shown in bold. In the dependency based subgraph all nodes in a shortest path are specialized using a posttag (IP). In the linear order subgraph possible tags are before (B), middle (M), and after (A). For the other two candidate pairs in the sentence, graphs with the same structure but different weights and labels would be generated.
