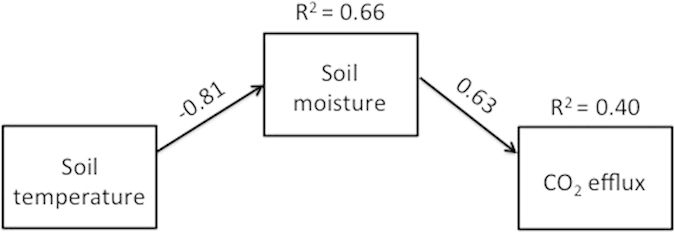
Figure 3. Path diagram displaying the role of soil temperature and soil moisture in regulating soil CO2 efflux rates under a reduced model.

Arrows represent unidirectional causal relationships. The amount of variation that can be explained by the model is indicated by the R2 values associated with each response variable. Standardized path coefficients (r) associated with each arrow reflect the strength of each relationship (p < 0.001 in both cases). The full model also included the direct assessment of temperature effects on CO2 efflux rates, but since that relationship was not statistically significant, no arrow is shown.
