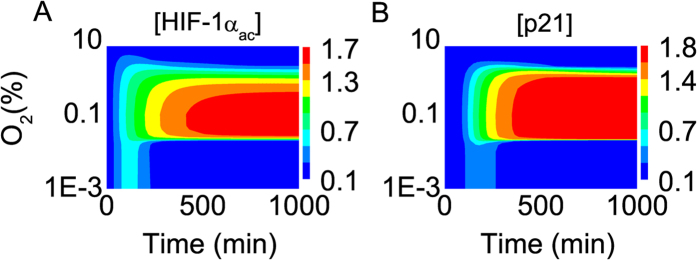
Figure 3. Dynamics of HIF-1αac and p21.

Color-coded concentrations of (A) HIF-1αac and (B) p21 as a function of the logarithm of oxygen concentration and time.

Color-coded concentrations of (A) HIF-1αac and (B) p21 as a function of the logarithm of oxygen concentration and time.