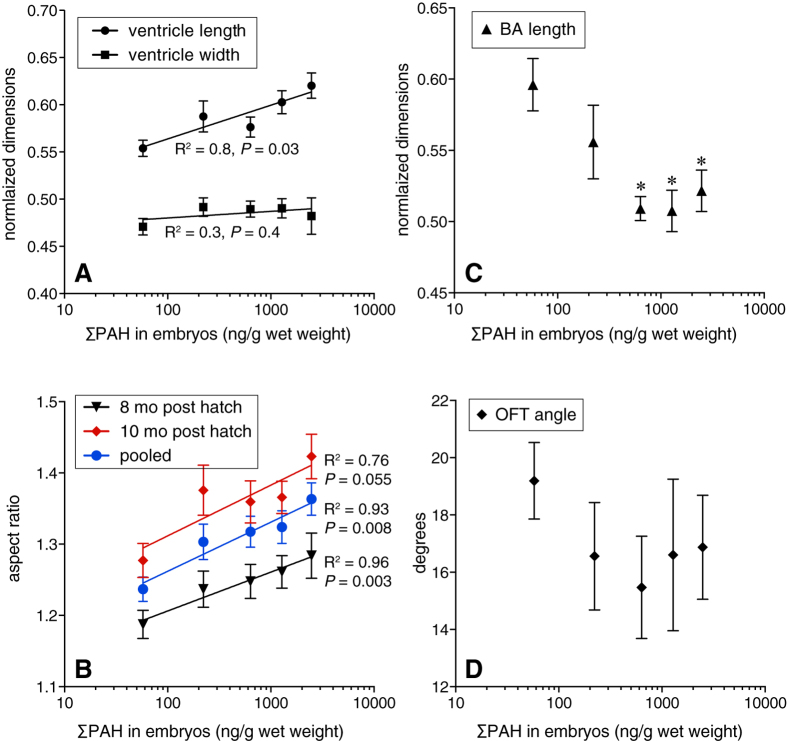
Figure 3. Dose-dependent changes in juvenile salmon cardiac morphology following embryonic oil exposure.
Anatomical locations of measurements are shown in Supplementary Fig. S7. (A) Ventricular length and width normalized to fish fork length measured in juveniles 8 months after exposure (mean ± s.e.m.). Data were fit to a linear regression model; P value indicates significance of the slope. (B) Ventricular aspect ratio measured in juveniles 8 months (triangles) and 10 months (diamonds) after exposure, and both age groups pooled (circles) fit a linear regression model (mean ± s.e.m). P values indicate significance of slope. (C) Length of the bulbus arteriosus normalized to ventricular length in juveniles 8 months after exposure (mean ± s.e.m.). Data did not fit linear or non-linear regression models, but were highly significant by ANOVA (P = 0.0012); asterisks indicate doses significantly different from control (Dunnett’s test, α = 0.05). (D) Outflow tract angle in juveniles 8 months following exposure (mean ± s.e.m.). For 8 month fish, N = 12 for all oil exposed groups, 13 for control; for 10 month fish, N = 20–23 for all groups except lowest oil exposure dose, N = 11.

