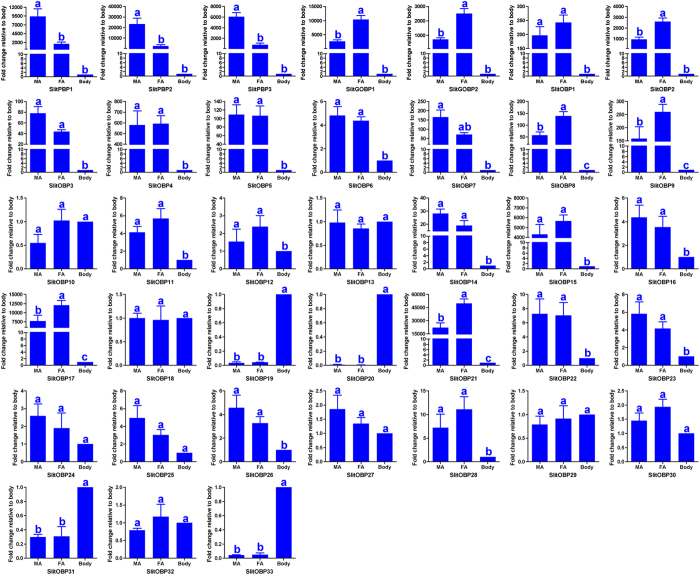
Figure 9. S. litura OBP transcript levels in different tissues as measured by RT-qPCR.
MA: male antennae; FA: female antennae. The internal controls β-actin and ribosomal protein L31 were used to normalize transcript levels in each sample. This figure was presented using β-actin as the reference gene to normalize the target gene expression and to correct sample-to-sample variation; similar results were obtained with ribosomal protein L31 as the reference gene. The standard error is represented by the error bar, and the different letters (a, b, c) above each bar denote significant differences (p < 0.05).

