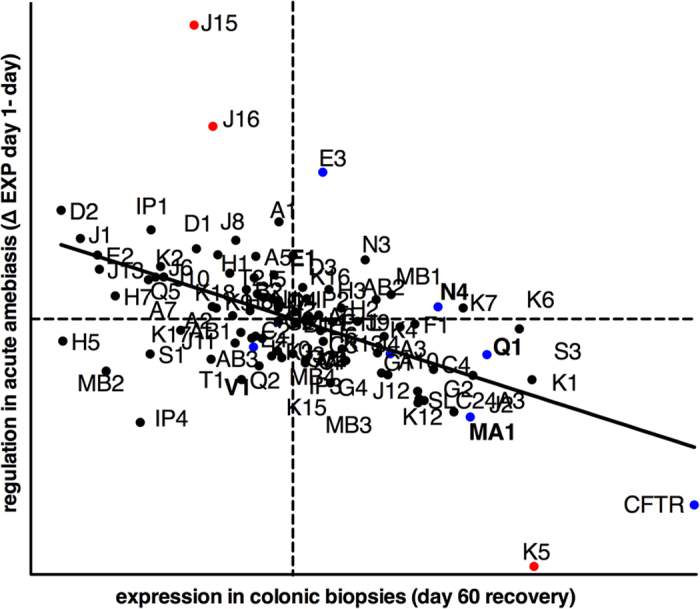
Figure 4. Kcn gene expression and regulation in the human colon in amebiasis.

Average gene expression (day 60) and regulation during acute amebiasis (Δ day 1–day 60) of the 94 annotated Kcn genes. Kcn was omitted from K+ channel gene names for clarity. Slc24a3 and Cftr are shown for reference. Kcn genes with documented intestinal expression are in blue. Genes that were significantly differentially regulated in disease are shown in red. Significance was determined as P < 0.001 by 2-way ANOVA of matched day 1 and day 60 samples (n = 8). Quadrants indicated the mean of expression (day 60) and regulation (Δ day 1–day 60) of all probes on the microarray. Normal expression (day 60) was significantly correlated with the regulation during disease (w day 1–day 60) by linear regression (n = 8 matched samples, R = −0.54 P > 0.0001.
