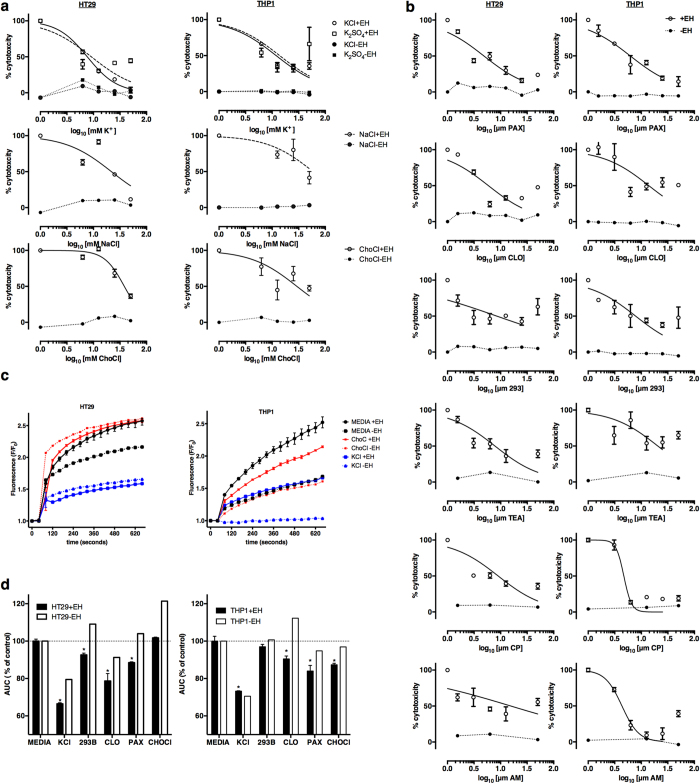
Figure 5. K+ inhibitors blocked amebic cytotoxicity and K+ activation by E. histolytica in intestinal epithelial cells and macrophages.
(a) Chemical inhibition of ion transport blocked amebic cytotoxicity. Cells were switched to the indicated concentrations of chemicals immediately prior to the addition of E. histolytica. (b) Specific K+ channel inhibitors blocked amebic cytotoxicity. Cells were treated with inhibitors for 30 minutes prior to the addition of E. histolytica. (c) K+ channel activation by E. histolytica. Fluorescence values correspond to thallium influx through open K+ channels. F values were normalized to the initial baseline value. E. histolytica (+EH) or vehicle (−EH) was added after 40 seconds. The mean of 3 biological replicates and the range is shown (+EH), −EH values are single measurements. (d) Inhibitors blocked K+ channel activation by E. histolytica. The mean of the area under the curve (AUC) for inhibitor-treated cells (KCl and ChoCl: 25 mM, 293B, CLO, PAX: 10 μ0) with (+EH) and without E. histolytica (−EH) is shown. The AUC (% of control) for each inhibitor was normalized to the media control (+EH was normalized to +EH control, −EH was normalized to −EH control). (+EH is the AUC of three biological replicates; error bars represent the range of measurements. *P < 0.001 calculated for each inhibitor relative to untreated cells by Fisher’s LSD test.

