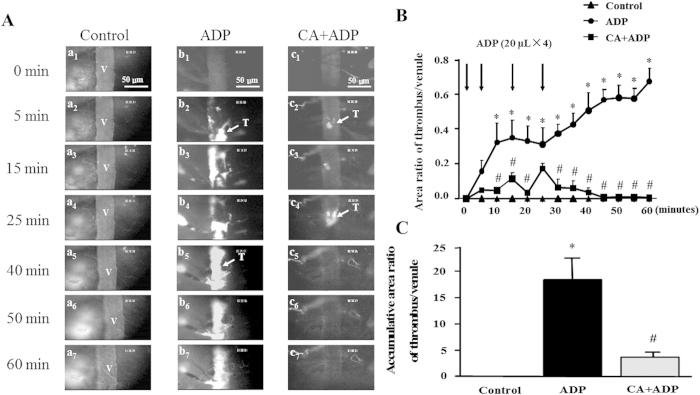
Figure 3. The inhibitory effect of CA on thrombosis in mouse cerebral venule.
(A) Presented are the representative images of thrombus formation in mouse cerebral venules in control, ADP, and CA + ADP group, at baseline (1), 5 (2), 15 (3), 25 (4), 40 (5), 50 (6), and 60 (7) min, respectively. Selected venules (V) have a diameter of 35–45 μm. Arrows indicate thrombus (T) formed in the venular lumen. (B) The effect of CA on time course of the area ratio of thrombus to mouse cerebral venule. (C) The effect of CA on accumulative area ratio of thrombus to mouse cerebral venule during 60 min. ADP: the animals were treated with ADP at 0, 5, 15, and 25 min, respectively. CA + ADP: the animals were treated with CA (5 mg/kg) starting from 20 min before thrombus induction. Data are expressed as means ± SEM (n = 10). *p < 0.05 vs control group, #p < 0.05 vs ADP group.

