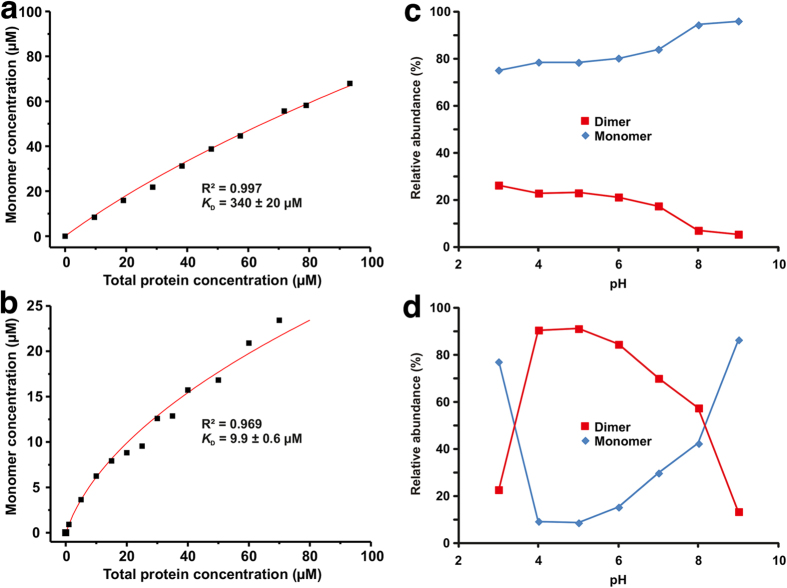
Figure 5. Protein monomer concentration as a function of total protein concentration for (a) rBos d 2 and (b) Bos d 5 as calculated from the native mass spectra.
The solid lines are the best fits of the data to Equation 4 (see, Online methods for details) for determining KD value for dimerization. Relative abundances of the protein monomer and the dimer for (c) rBos d 2 and (d) Bos d 5 depending on solution pH at a protein (monomer) concentration of 40 μM.

