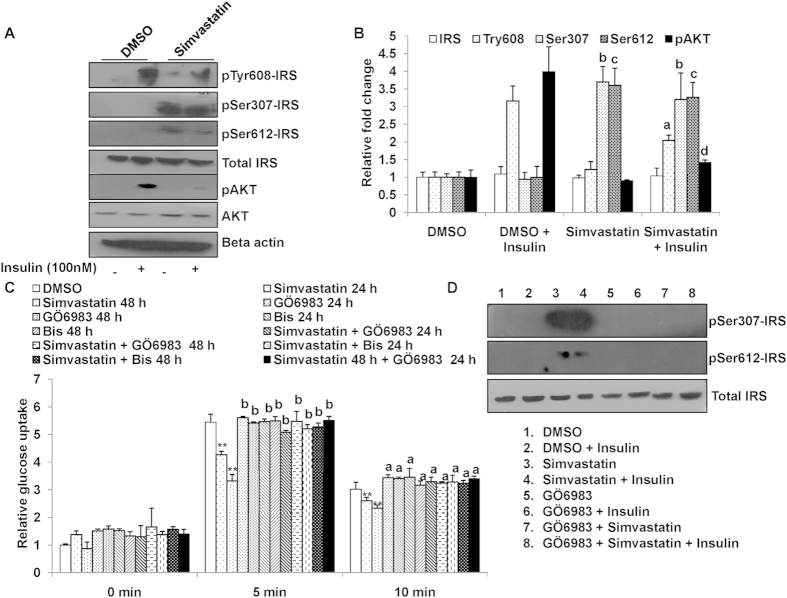
Figure 4.
(a) Simvastatin treatment inhibits insulin signaling cascade: L6 myotubes were cultured in Simvastatin for 48 h, followed by stimulation with insulin for 20 min. Cells were lysed and probed for phosphorylation of IRS-1 (Ser307and Ser612, Tyr608) and pAKT. Total IRS-1, AKT and Beta-actin served as loading control. The cropped blots were run under the same experimental conditions. The full-length blots are included in Supplemental Figure 4. (b) Densitometric quantification results for western blots from Fig. 4A are shown. Values are shown as mean ± SD after normalizing with the corresponding protein content and expressed relative to basal (DMSO) of control cells which was set to 1; a,dp < 0.05 versus DMSO + insulin treated cells, b,cp < 0.005 versus corresponding DMSO treated cells (two way ANOVA). (c) Inhibition of PKC rescues Simvastatin inhibited insulin mediated glucose uptake: Mean basal and insulin stimulated (5 min and 10 min) uptake of 2-NBDG by L6 myotubes treated with Simvastatin (1 μM) and/or PKC inhibitors (Bisindolylmaleimide I, Bis (1 μM) and GÖ6983 (1 μM) for different time points as indicated. DMSO (0.1%) treated cells served as internal control. Values are shown as mean ± SD after normalizing with the corresponding protein content and expressed relative to basal of control cells which was set to 1; **p < 0.01, versus corresponding control cells, bp < 0.005 versus corresponding Simvastatin treated cells (two way ANOVA). (d) Pharmaocological Inhibition of PKC pathway diminished simvastatin induced IRS serine phosphorylation. L6 myotubes were cultured in Simvastatin (1 μM) and/or GÖ6983 (1 μM) for 48 h, followed by stimulation with insulin for 20 min. Cells were lysed and probed for phosphorylation of IRS-1 (Ser307and Ser612) and total IRS-1. The cropped blots were run under the same experimental conditions. The full-length blots are included in Supplemental Figure 4.

