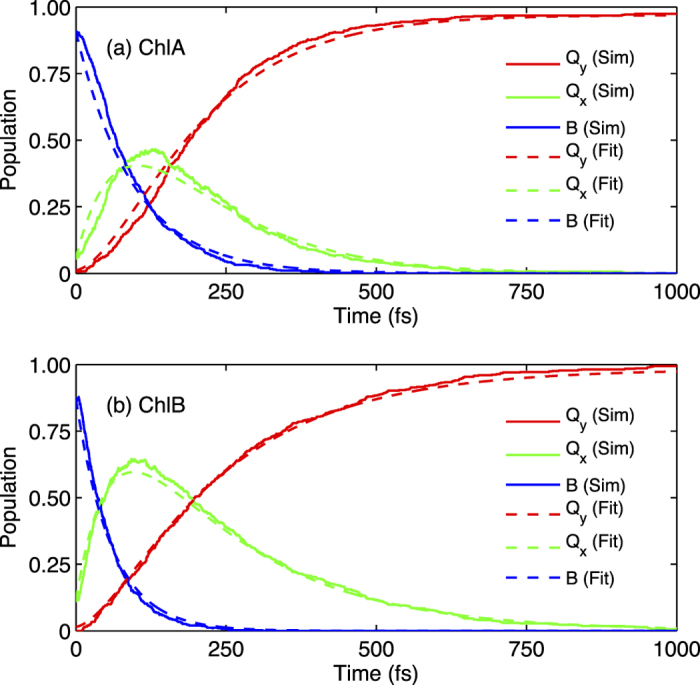
Figure 5. Averaged excited state populations of Qy (red), Qx (green), and B (blue) bands in (a) ChlA and (b) ChlB species during a 500 trajectory nonadiabatic excited-state molecular dynamics (NA-ESMD) simulation (Sim).

Population model fit (first-order, irreversible) is also shown for Qy, Qx, and B bands (Fit). The excited state simulations were run for 1 ps, and began with an excitation pulse centered around the B band.
