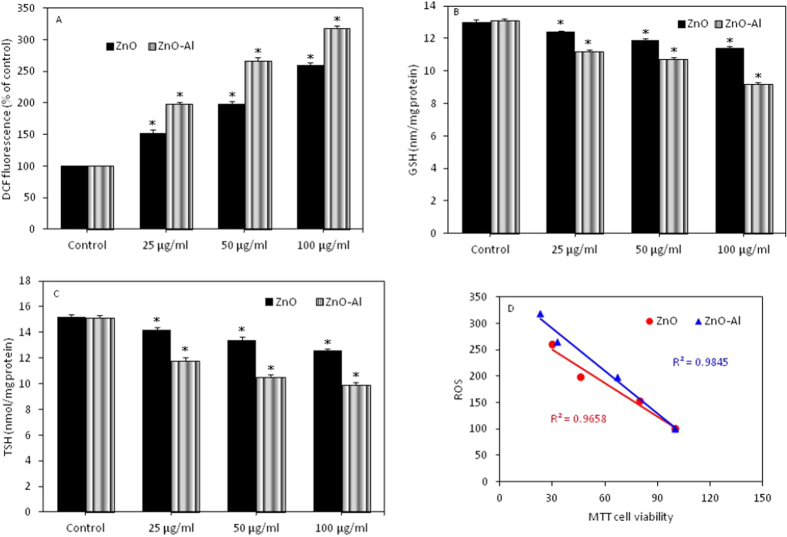
Figure 5. Oxidative stress response of pure and Al-doped ZnO nanoparticles in MCF-7 cells.
(A) ROS, (B) GSH and (C) TSH. Data represented are mean ± SD of three identical experiments made in triplicate. *Statistically significant difference as compared to controls (p < 0.05). (D) Significant negative correlation between MTT and ROS.

