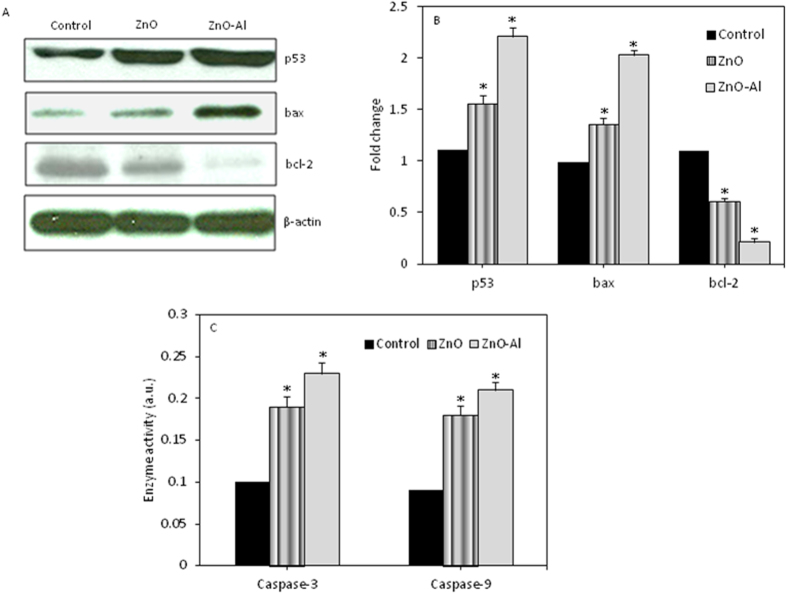
Figure 9. Western blot analysis of protein levels of apoptotic genes in MCF-7 cells due to pure and Al-doped ZnO nanoparticles exposure.
(A) Immunoblot images of p53, bax and bcl-2 proteins. Blots are cropped and no other bands were observed. All the gels have run under same experimental conditions. (B) Protein levels were also analyzed by densitometric analysis using AlphaEase TM FC StandAlone V.4.0.0 software. Bar diagrams are from mean ± SD of three immunoblots. Results are expressed as a fold change over the control group. (C) Pure and Al-doped ZnO nanoparticles induced the activity of caspase-3 and caspase-9 enzymes. Enzyme data represented are mean ± SD of three identical experiments made in three replicate. *Statistically significant difference as compared to the controls (p < 0.05).

