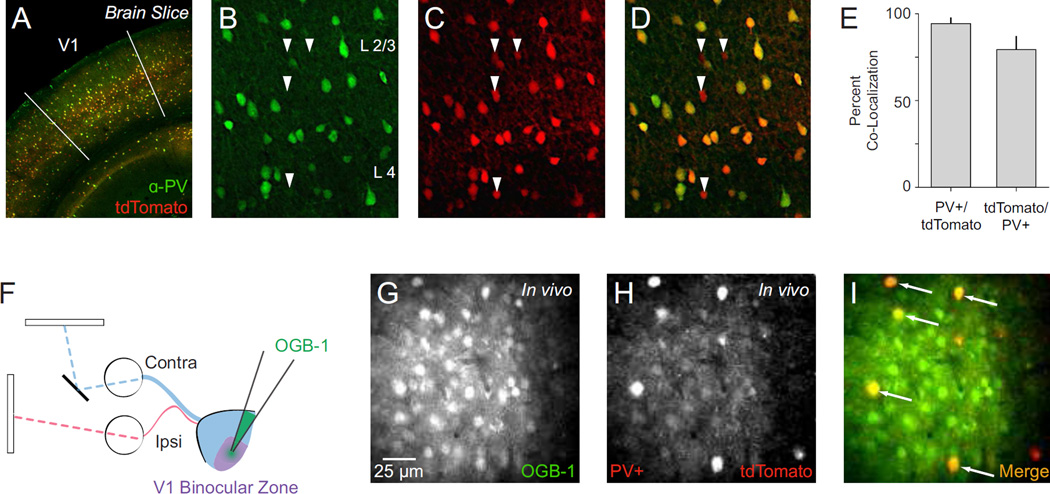
Figure 1. Characterization of PV-Cre knock-in mouse and two-photon in vivo imaging of PV+ interneurons.
(A) Representative PV-Cre;Ai14 mouse cortex stained for parvalbumin (PV) with V1 delineated. (B–D) Maximal projections showing co-localization of PV and tdTomato in cortical layers 2–4. In these panels all PV+ neurons are tdTomato+. Arrows indicate tdTomato+/PV− neurons. (E) Summary data on PV-tdTomato co-localization in V1. Counts obtained from cortical layers 2–5. (F) Dichoptic stimulus presentation used to evoke calcium responses. OGB-1 bulk loaded in mouse V1 binocular zone. (G) Two-photon image of OGB-1 In vivo. (H) Same as in (G) for tdTomato. (I) Merged OGB-1 and tdTomato signals. Cells with co-localized fluorescence (putative PV+ interneurons) appear yellow (arrows).

