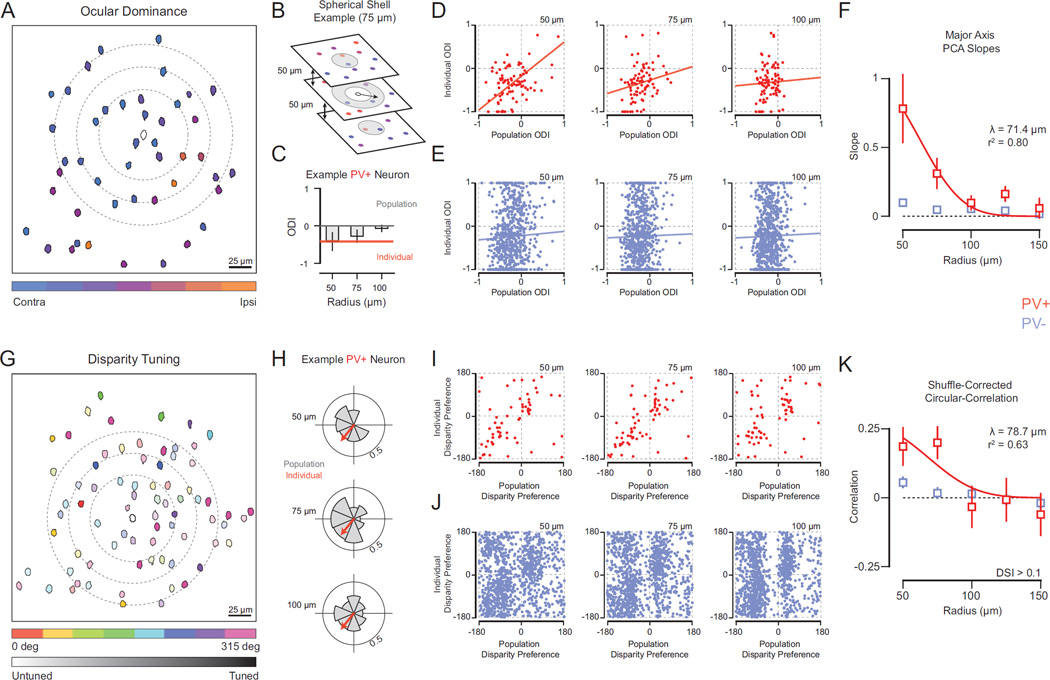
Figure 4. Spatial relationship of PV+ interneuron functional properties and local population aggregate.
(A) Map of ocular dominance in V1 at single focal plane (depth = 420 µm). Cell masks colorcoded based on eye preference or ocular dominance index (ODI). Example PV+ interneuron in center (mask outline). Rings (dashed line) depict subset of radii tested (50 – 100 µm). (B) Example volume (radius = 75 µm) to generate local PV− neuron population. Neurons within boundary (gray shading) comprise this population. Note that at the individual PV+ interneuron’s focal location, volume is shown as ring because the inner sphere volume (radius = 50 µm) is excluded. For distances greater than 50 µm (a sphere), we restricted regions to avoid drawing from the same local population at different distances (spherical shells). (C) Example PV+ interneuron ODI (orange) and population average ODI at different radii (gray) (50 – 100 µm). (D) Plots of individual PV+ interneuron ODI and local population average (red) at different radii. Linear fits depict major axis PCA slope and y-intercept computed from Bootstrapped PCA. (E) Same as (D) for PV− neurons (blue). (F) Spatial dependence of relationship between individual cell and local populations. PV+ interneuron (red) and PV− neuron (blue) Bootstrapped PCA across radii. Spatial length constant (λ) computed from an exponential fit (red line). (G) Map of binocular disparity selectivity at single focal plane (depth = 400 µm). Cell masks color-coded based on disparity preference (0–315 deg). Color hue indicates disparity selectivity index (DSI). Example PV+ interneuron is shown in the center (mask outline). Rings (dashed line) depict subset of radii tested (50–100 µm). (H) Disparity selectivity in individual neurons are decomposed into polar vectors with an amplitude (DSI) and angle (disparity preference). Shown is an example PV+ interneuron disparity vector (orange arrow) and polar histogram of surrounding PV− vectors (gray) at three different distances (50 – 100 µm). (I) Plots of individual PV+ interneuron disparity preference and population average disparity preference for different radii (red). (J) Same as (i) for PV− neurons (blue). The observed biases in population average disparity preferences are due to non-uniform distributions of disparity preference within individual animals. However, because the exact position of the stimulation monitors and eye positions are different for each experiment, we do have an interpretation for these biases across subjects. (K) Spatial dependence of relationship between individual cell and local populations. PV+ interneuron (red) and PV− (blue) neuron shuffled-corrected circular-correlations shown across radii. Spatial length constant (λ) computed from an exponential fit (red line).

