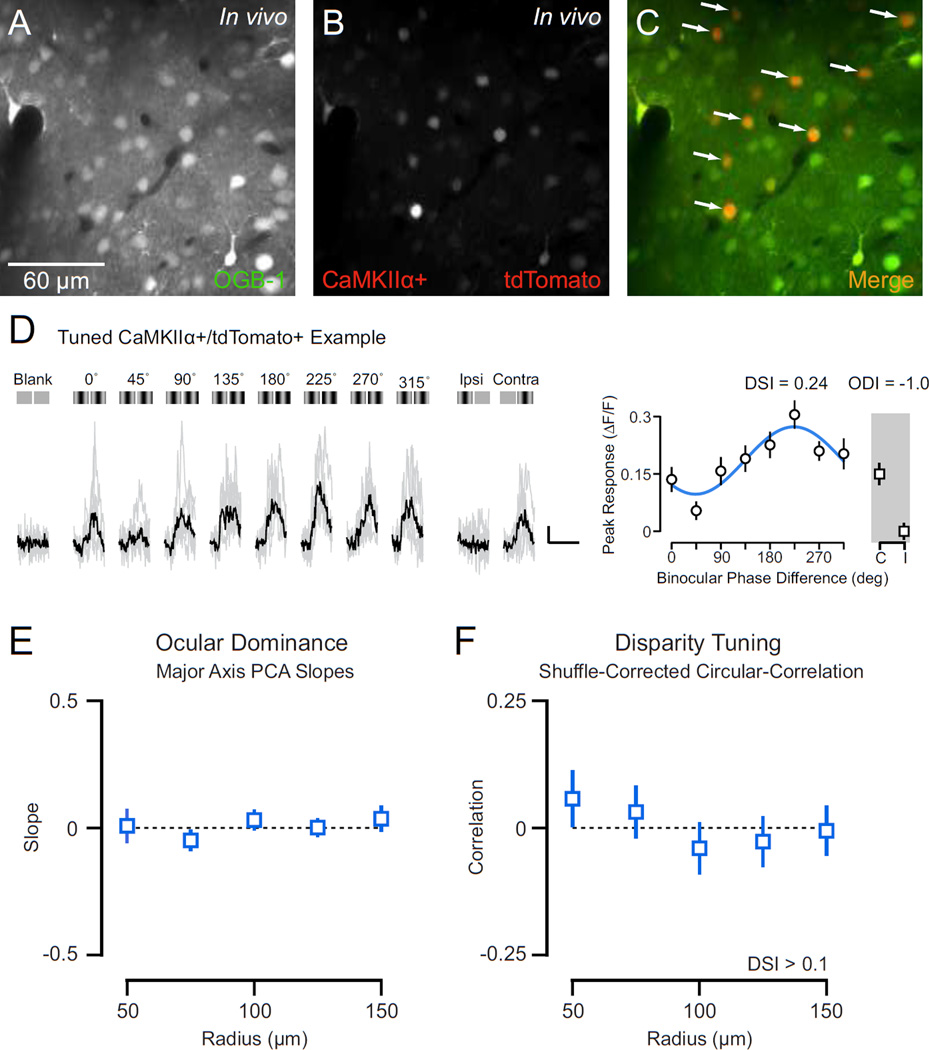
Figure 5. Spatial relationship of excitatory neuron functional properties and local population aggregate.
(A) Two-photon image of OGB-1 in vivo. (B) Same as in (A) for tdTomato. (C) Merge of OGB-1 and tdTomato. Cells with co-localized fluorescence (putative CamKIIα+ excitatory neurons) appear yellow (arrows). (D) Example calcium responses in a tdTomato+/CamKIIα+ excitatory neuron evoked by a range of binocular disparities (0–315 deg), monocular stimulation of each eye, and a mean luminance screen. Individual traces shown in gray and trial-average mean shown in black. Illustration of each stimulus shown above traces. Scale bar indicates 10% change in fluorescence (ΔF/F) and 2 sec duration. Mean ΔF/F and standard error shown in a tuning curve. Tuning curve shown is fit with a cosine function. (E) Spatial dependence of relationship between individual excitatory neuron ocular dominance and local populations. Shown is mean Bootstrapped PCA slope and standard error across radii. (F) Spatial dependence of relationship between individual excitatory neuron disparity preference and local populations. Shown are shuffled-corrected circular-correlations across radii.

