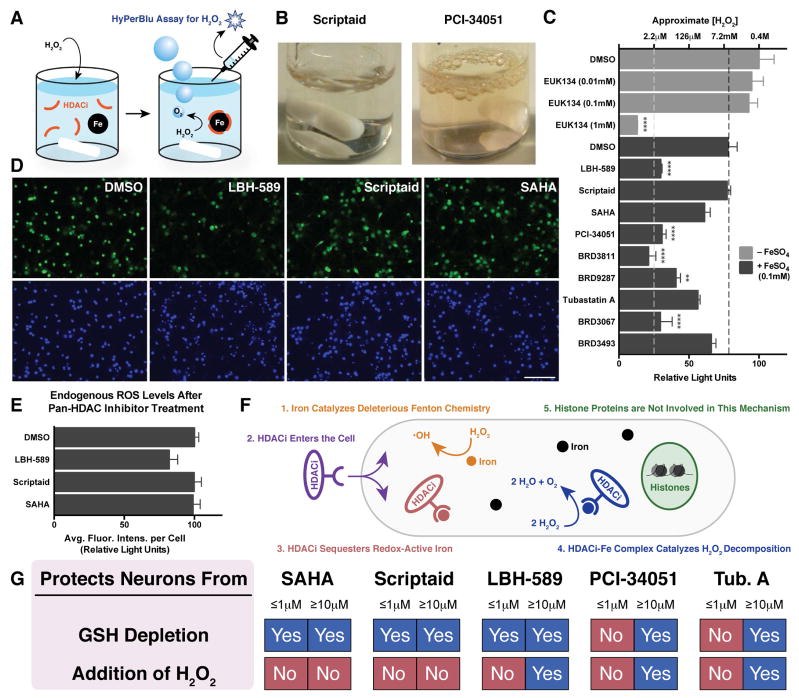
Figure 4. Hydroxamate-based HDAC inhibitor-iron complexes catalyze the decomposition of H2O2 and mitigate intracellular ROS levels.
(A) Schematic depicting an in vitro H2O2 decomposition assay. (B) Reactions employing hydroxamate-based HDACi-iron complexes capable of catalyzing the disproportionation of H2O2 into water and gaseous O2 produce effervescence. (C) Some hydroxamate-based HDAC inhibitors (HDACi), in combination with FeSO4, are capable of drastically reducing in vitro levels of H2O2 while others cannot. The black dotted line indicates the decomposition of H2O2 resulting from DMSO + FeSO4 only. Concentrations below the white dotted line fall outside the linear range of this assay. Data are shown as mean ± SEM. Significance was established relative to DMSO + FeSO4. *P ≤ 0.05, **P ≤ 0.01, ***P ≤ 0.001, ****P ≤ 0.0001 from Tukey post hoc test following a one-way analysis of variance (ANOVA). (D) Rat cortical neurons were treated with HDAC inhibitors at 30 μM for 24h before endogenous levels of intracellular ROS were determined using the ROS-sensitive fluorescein derivative CM-H2DCFDA. The scale bar denotes 100 μm. (E) Quantification of endogenous ROS levels shows that the catalase mimetic properties of LBH-589 can reduce endogenous ROS levels. Data are shown as mean ± SEM. (F) Schematic depiction of a model for an HDAC-independent neuroprotection mechanism (G) Summary of neuroprotective effects at either low (≤1μM) or high (≥10μM) concentrations. See also Figures S3 and S4.

