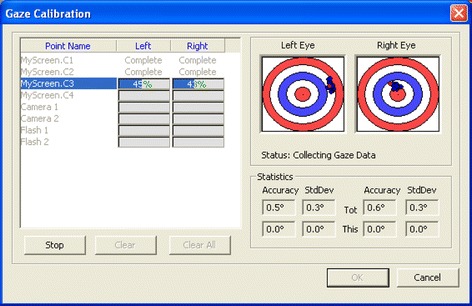
Fig. 5.

Gaze calibration procedure. The red dot shows where the current un-calibrated gaze intersects a plane, orthogonal to the current world point and a vector pointing towards the centre of the eye. The blue dots represent all saved samples, whereas the green dots show the samples once the calibration algorithm has been run on them. Ideally the green dots should be in the middle of both the target. One circle in the target corresponds to ±2° of accuracy. We carefully checked that the blue dots were close together without outliers, and any outliers that were found were cleared and new samples were added again. We manually repeated this operation until the noise became smaller
