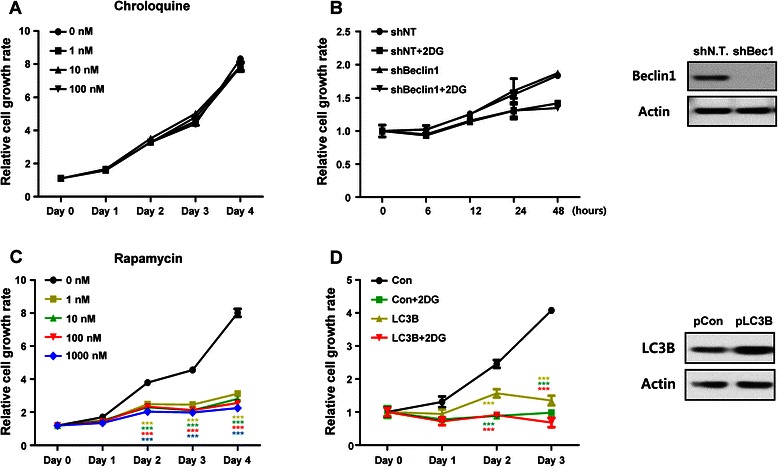
Fig. 5.

Induction of autophagy suppresses cell growth and survival. Autophagic flux was regulated by chemical treatment or genetic modification to prove the relationship between autophagic flux and cell growth. Autophagy was blocked with a various concentrations of CQ treatment or (b) Beclin1-targeting shRNA. The level of Beclin1 expression was confirmed with western blotting for Beclin1 (Right panel). (c) Autophagy was induced with rapamycin at the indicated concentrations. The level of LC3B expression was confirmed with western blotting for LC3B (Right panel). Data are represented as the means ± SD, ***P < 0.001 versus 1 nM, ***P < 0.001 versus 10 nM, ***P < 0.001 versus 100 nM, ***P < 0.001 versus 1000 nM. (d) The LC3B plasmid to overexpress LC3B was introduced into PC3 cells. Data are represented as the means ± SD. ***P < 0.001 versus 2DG, ***P < 0.001 versus LC3B, ***P < 0.001 versus LC3B + 2DG. Cell growth rate was measured using an MTT assay (a and c) or cell counting (b and d). Autophagy blocking did not show a synergistic effect with 2DG to regulate cell growth. However, autophagy induction suppressed cell growth, not only with LC3B overexpression, but also with 2DG combination treatment, which showed a synergistic cell suppression effect
