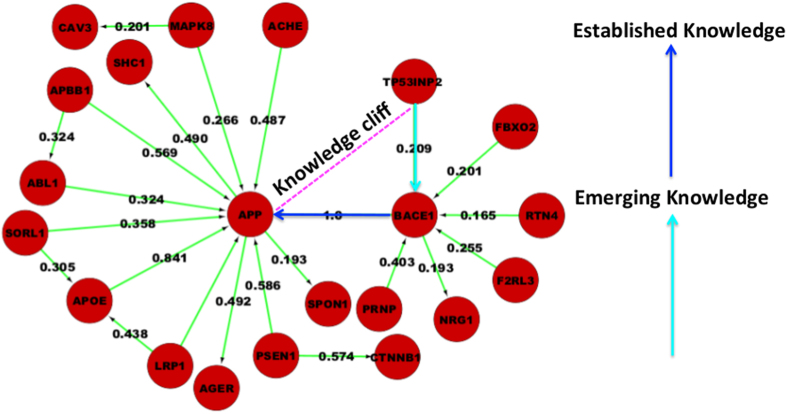
Figure 3. Knowledge cliff representation with in a disease network.
Coherent sub-graphs where ratio of adjoining interaction scores is maximum are represented as knowledge cliff. Knowledge cliff helps us finding new emerging candidates sticking to the established candidates, which are well known to play a role in the disease.

