Figure 1.

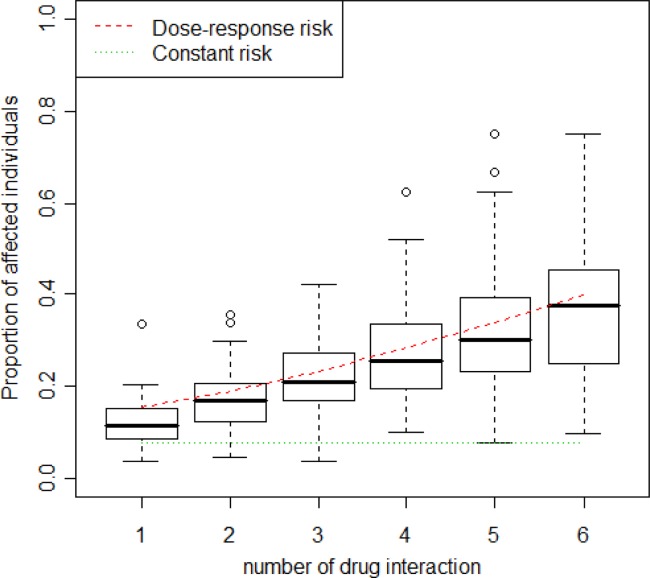
Distribution of the proportion of affected individuals over different drug combinations. Fitted regressions for two groups are fitted on these boxplots.

Distribution of the proportion of affected individuals over different drug combinations. Fitted regressions for two groups are fitted on these boxplots.