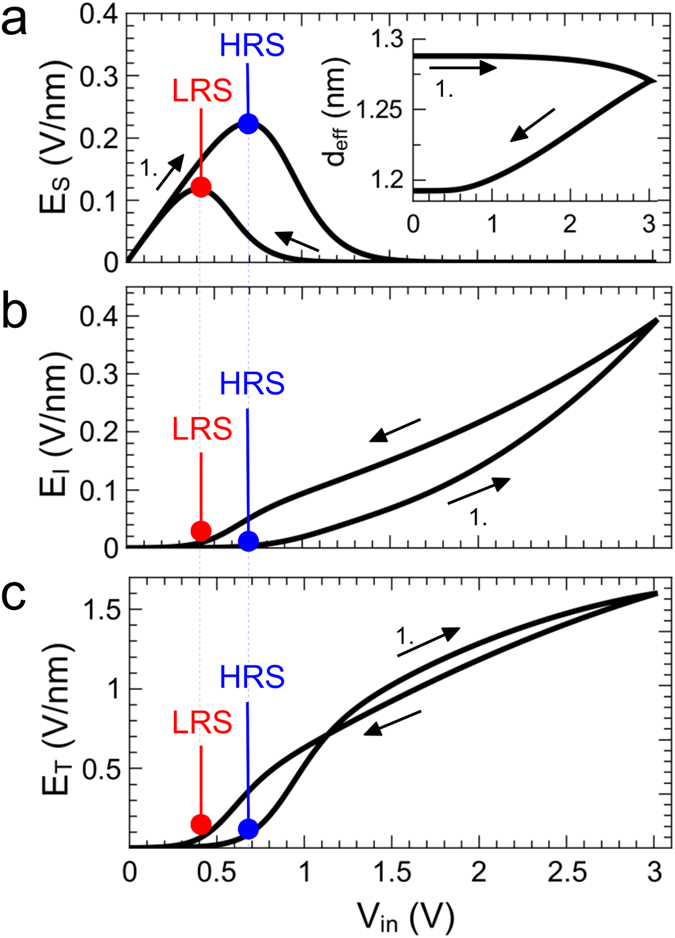
Figure 6. Local electrical field strengths.

Calculated electrical fields across the Schottky contact ES, the NbyOx layer EI (b), and across the tunnelling barrier ET (b) during a positive voltage sweep. The onset current of the Schottky diode for the LRS and HRS are marked in red and blue, respectively. The black arrows show the direction of the voltage sweep. Inset: Corresponding change in effective tunneling distance.
