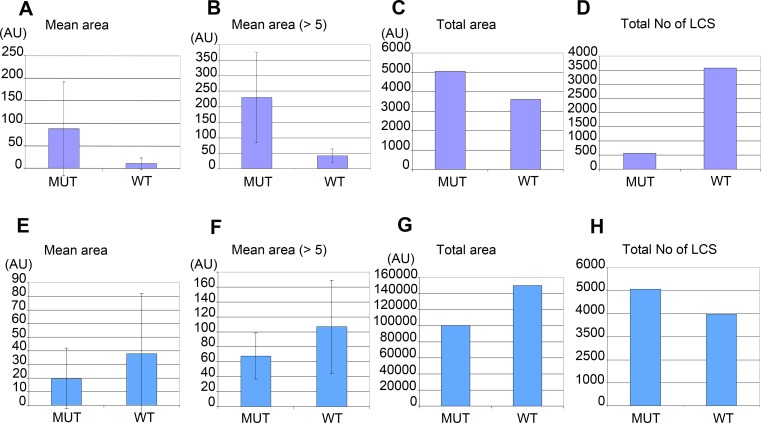
Figure 6. Morphometric analysis of lipid containing structures by CARS microscopy in wild type and W01A8.1 null animals.
Morphometric analysis was performed on CARS positive structures in single focal plane images acquired from representative mutant and wild type animal image stacks. (A–D) compare early embryos from mutant (MUT) and wild type (WT) animals using seven representative CARS images. (A) shows the mean area of all individually recognizable structures and (B) shows the mean area of all individually recognizable structures with an area bigger or equal to 5 arbitrary units (derived from pixels at the same settings). (C) compares the total area of all CARS positive structures in mutant and wild type embryos while (D) compares the total number of individually recognizable CARS positive structures (lipid containing structures—LCS) in the same embryos. (E–H) compare adult somatic tissue (tail region) from mutants and wild type hermaphrodites using five representative CARS images. (E) shows the mean area of all individually recognizable CARS positive structures and (F) shows the mean area of all individually recognizable structures with an area bigger or equal to 5 arbitrary units. (G) compares the total area of all CARS positive structures in mutant and wild type tail regions while (H) compares the total number of individually recognizable CARS positive structures (LCS) in the same regions. Vertical bars in (A, B, E) and (F) represent Standard Deviation. The results presented in (A, B, E) and (F) are statistically significant in two-tailed Student’s t-test (p < 0.0001).

