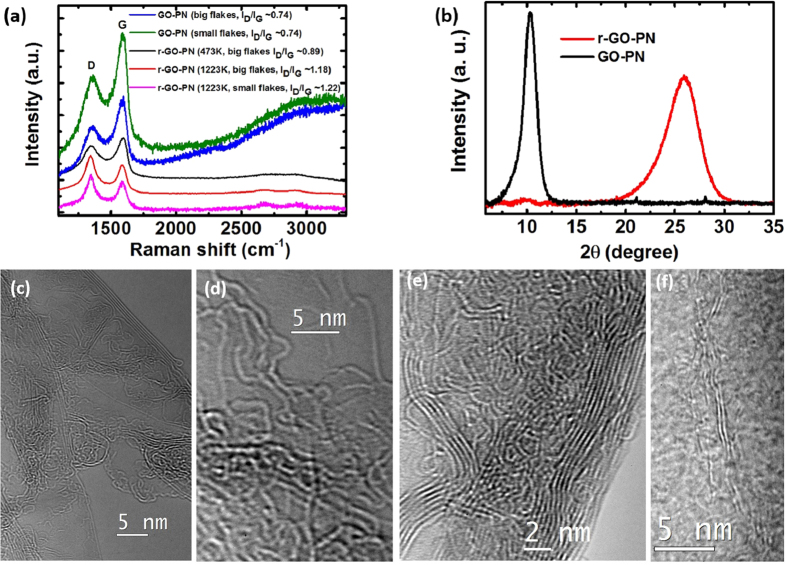
Figure 3. Characterization of the porous networks.
(a) Raman spectra of the as prepared GO-PN and rGO-PN treated at 473 and 1223K. (b) XRD spectra of GO-sus, GO-PN and rGO-PN. (c–f) TEM observations. In (c) it is shown the presence of highly curved monolayer to few layer flakes in the rGO-PN. (d) In the high resolution phase contrast image of the edge of a single layer flake, in-plane carbon atoms are resolved and a variety of n-membered carbon rings can be seen. In (e) and (f) it is shown that the flakes composing the wall are entangled with each other.

