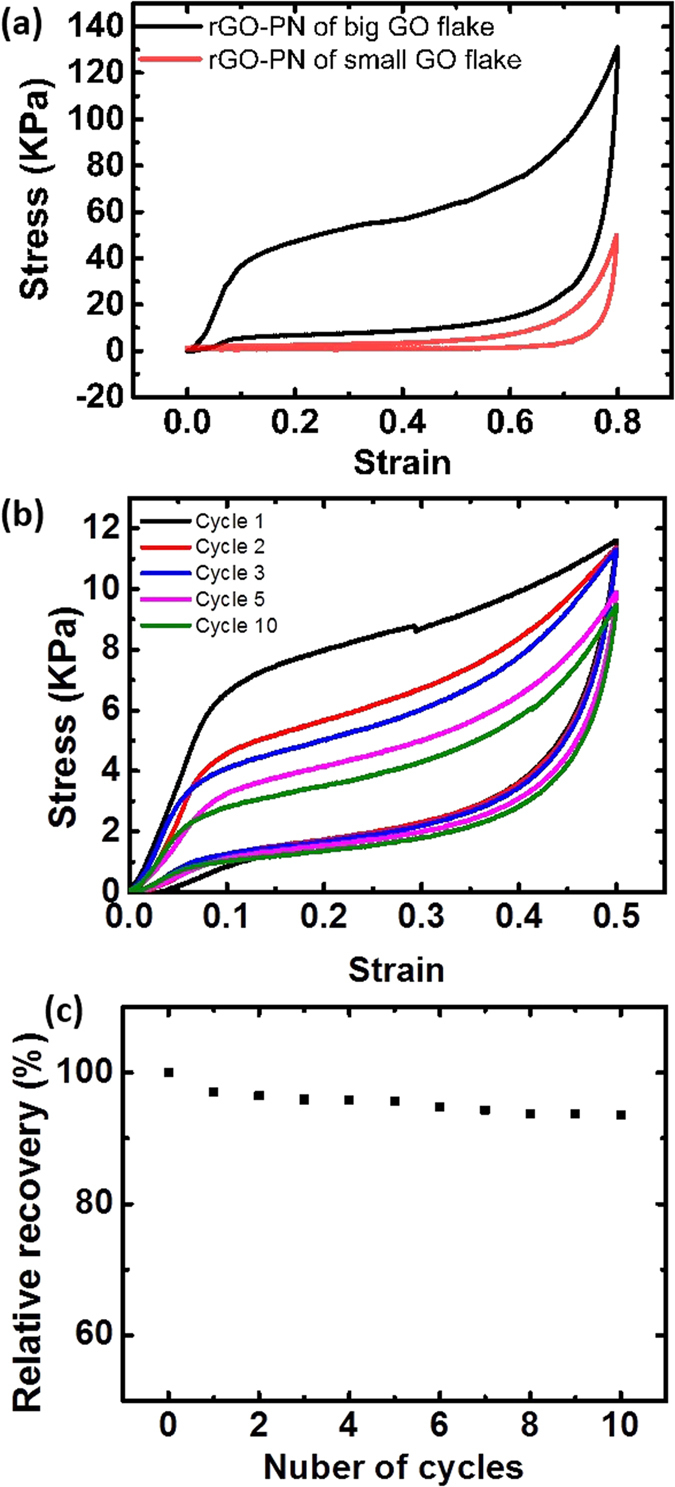
Figure 4. Typical compressive properties of the porous networks.

(a) Compressive stress-strain curves tested at the maximum strain of 80% for two rGO-PN samples of similar density (ρ ∼ 11 mg/cm3) produced using big or small GO flakes. (b) The stress-strain curve for a rGO-PN (ρ ∼ 4.5 mg/cm3) tested at the maximum strain of 50% for 10 cycles. The strain rate for these test were 0.001 s−1. (c) The relative recovery after 50% strain for a rGO-PN with ρ ∼ 4.5 mg/cm3. Unless it is stated specifically the porous networks were produced using big GO-flakes with a cold finger cooling rate of 10 K min−1 during ice templating followed by heat treatment at 1223 K.
