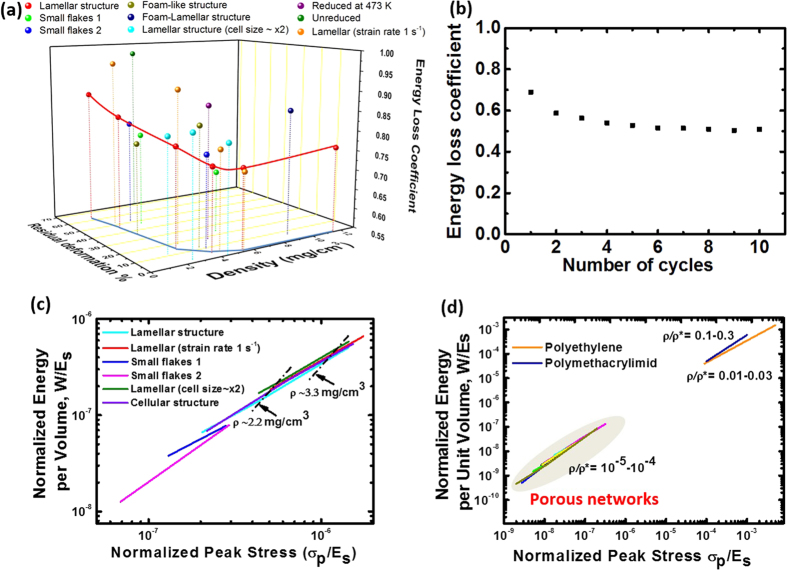
Figure 8. Energy loss coefficients of porous networks (a) produced with different conditions and (b) under a cyclic compressive test.
(c) Energy-absorption diagrams for the porous networks produced and tested at different conditions. Parallel black dash-dot lines (arrowed) connect data for samples with same density but obtained at different strain rates, giving a family of lines of constant sample density. (d) Comparison between the porous networks and polymer foams in the energy-absorption diagram. Unless specified, the fabrication and testing conditions are: big GO flakes, lamellar structure, 10 K min−1 cold finger cooling rate during freeze casting, heat treatment at 1223 K and compressive test at strain rate of 0.001 s−1. As noted in the main text, the lamellar structure has a cell size of ∼15 μm and the size is approximately doubled by decreasing the cooling rate from 10 K min−1 to 1 K min−1 for the sample labelled as “Lamellar (cell size × 2)”.

