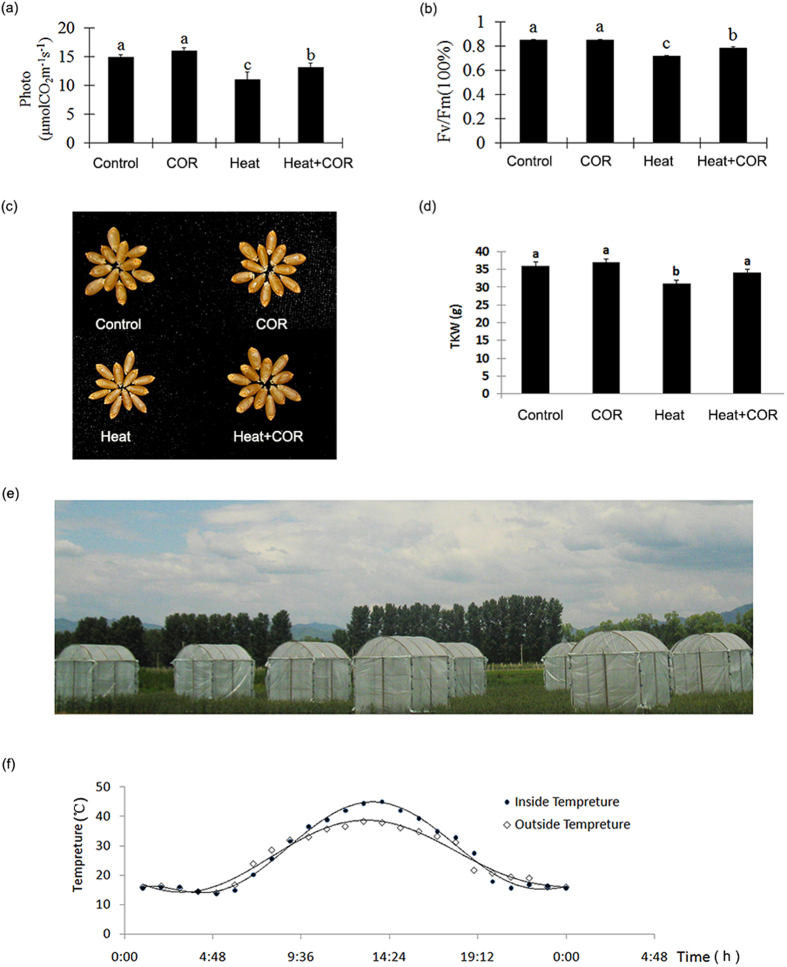
Figure 4. Coronatine induced photosynthesis and yield variation.
(a) Photosynthetic performance of different treatment. Four treatments: Control: outside the shed for 7 days after water pretreatment for 24 hrs; COR: outside the shed for 7days after coronatine pretreatment for 24 hrs; Heat: inside the shed for 7 days after water pretreatment for 24 hrs; COR + Heat: inside the shed for 7 days after coronatine pretreatment no shed for 24 hrs. The photosynthetic capacity was shown as mean ± SD from 3 replicates (n = 20 lines/replicate; Bars labeled with different letter are significantly different at P > 0.05 as determined by LSD test). (b) Chlorophyll fluorescence of different treatment. The chlorophyll fluorescence was shown as mean ± SD from 3 replicates (n = 20 lines/replicate; Bars labeled with different letter were significantly different at P > 0.05 as determined by LSD test). (c) Phenotype of wheat grain in different treatment. (d) TKW (Thousand Kernel Weight) of different treatment corresponding with figure C. The TKW was shown as mean ± SD from 3 replicates (n = 20 lines/replicate; Bars labeled with different letter were significantly different at P > 0.05 as determined by LSD test). (e) Simplified shed for heat stress. The height of shed is 2.5 m, and 1.5 m width, 0.5 m height opened at the bottom for gas exchange. Picture was taken by Yuyi Zhou. (f) The different temperature between inside and outside the shed. The temperature recorded by auto-thermometer through the whole day.

