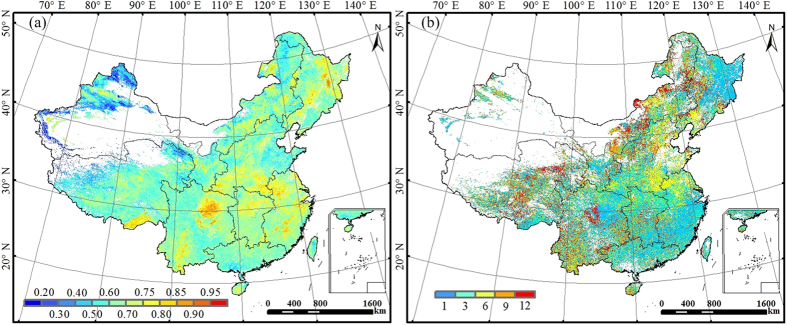
Figure 5. Spatial distribution of the correlations between monthly WUE and SPI for the period of 2000–2011.

(a) The values represent the maximum correlation recorded (Pearson coefficient, R) for each pixel, independently of the month of the year and the SPI time-scale. (b) SPI time-scales at which the maximum correlation between SPI and WUE recorded. Areas with no significant correlations (p>0.05) are indicated in white. This figure was produced using ArcGIS 10.0.
