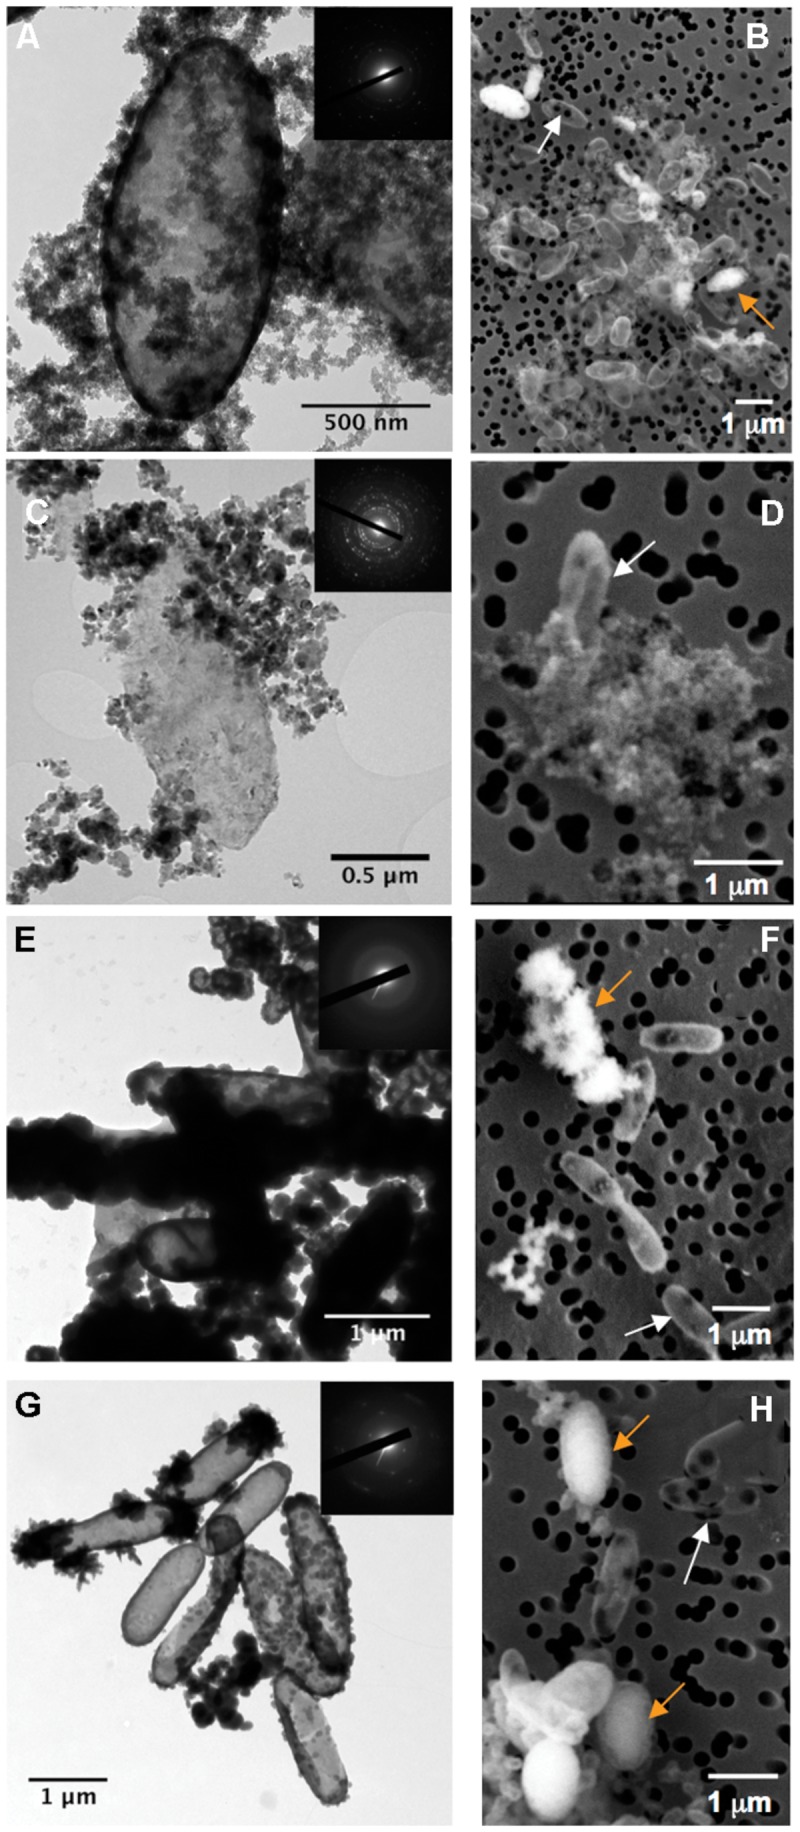
FIGURE 1.

Electron microscopy analysis of BoFeN1 cells cultured in the different biomineralization media: (A,B); Lp-, (C,D); Mt-, (E,F); FeP- and (G,H); Gt-media. (A,C,E,G) are TEM images and (B,D,F,H) are scanning electron microscopy (SEM) images in secondary electron mode. Insets display corresponding selected area electron diffraction (SAED) patterns of lepidocrocite (A), magnetite (C), amorphous Fe-phosphate (E), and goethite (G). White and orange arrows indicate non-encrusted vs. encrusted cells, respectively.
