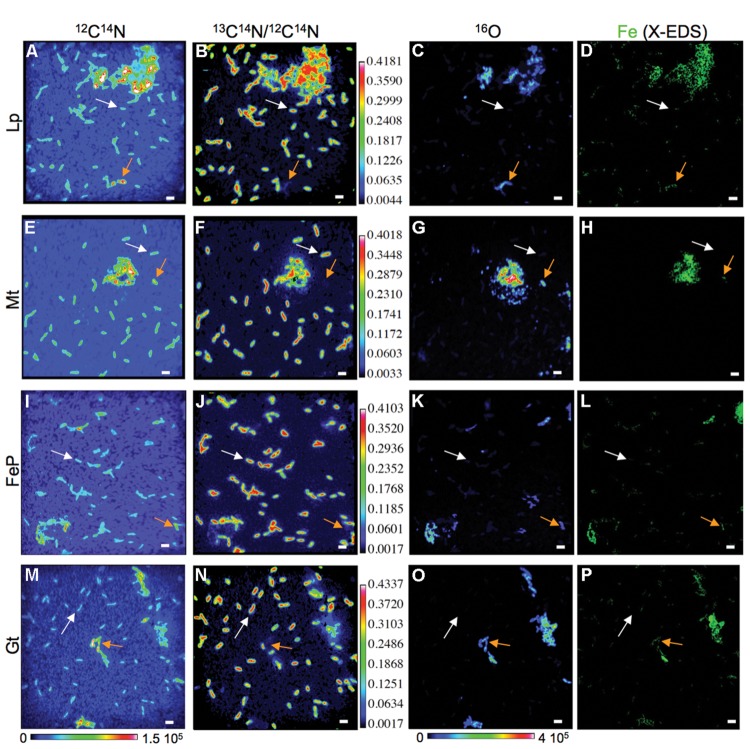
FIGURE 3.
Differences in carbon assimilation among mineralized (orange arrows) and non-mineralized (white arrows) cells in cultures of BoFeN1 grown for 4 days (tmin = 4 days) in biomineralization medium (Lp-, Mt-, FeP-, or Gt-media) then transferred to labeled medium for 4 days. NanoSIMS images of 12C14N- signal (A,E,I,M), 13C14N/12C14N ratio (B,F,J,N) and 16O- signal (C,G,K,O) and corresponding X-EDS maps showing the distribution of Fe (green, D,H,L,P). Scale bars: 2 μm.

