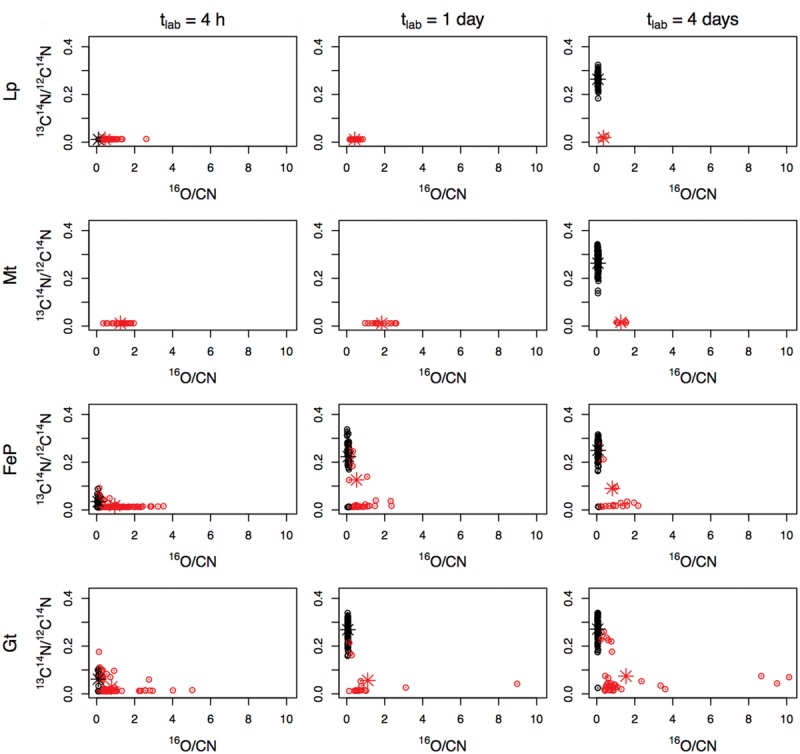
FIGURE 6.

13C14N/12C14N as a function of 16O/CN determined by NanoSIMS in single mineralized (red) and non-mineralized (black) cells grown for 4 days (tmin = 4 days) in biomineralization medium (Lp-, Mt-, FeP-, Gt-media) then transferred for 4 h, 1 day, or 4 days in labeled medium. Errors on y-axis values were calculated as (1/13C14N + 1/12C14N)1/2, and correspond to negligible values; the representation of data (circles) is larger than and encompasses the error bars. The barycenter of each group of points (mineralized vs. non-mineralized subpopulations) is displayed as (red vs. black) star.
