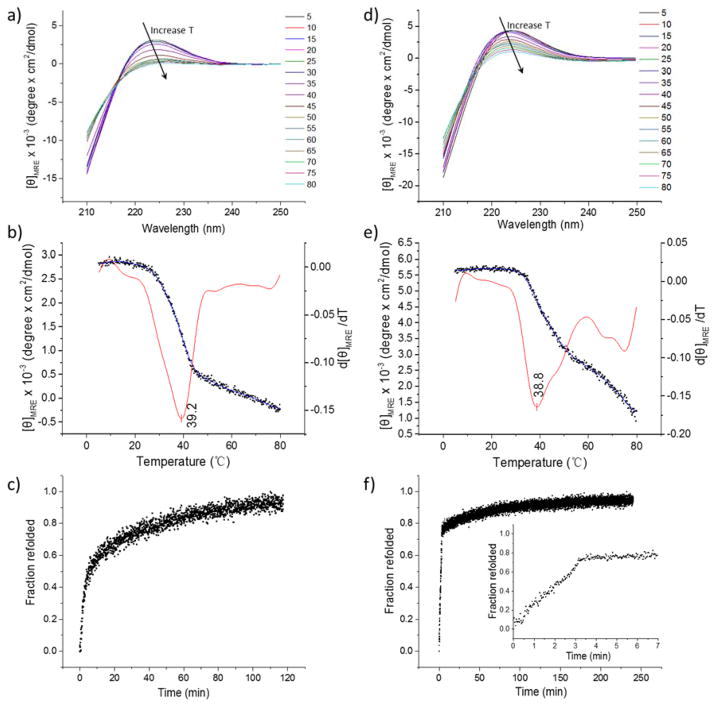
Figure 3.
a) CD spectra showing the wavelength scans for the collagen like peptide; b) Blue curve with dots (Y axis on the left side): thermal unfolding profile for CLP plotted as [θ]MRE225nm versus temperature. The red curve (Y axis on the right side) is the first derivative of the unfolding curve with respect to temperature; c) Refolding profile of CLP after quenching to 5 °C; d) CD spectra showing the wavelength scans for PDEGMEMA-CLP diblock; e) Blue curve with dots (Y axis on the left side): thermal unfolding profile for PDEGMEMA-CLP diblock plotted as [θ]MRE225nm versus temperature. The red curve (Y axis on the right side) is the first derivative of the unfolding curve with respect to temperature; f) Refolding profile of the PDEGMEMA-CLP diblock after quenching to 5 °C, with an inserted image from 0 – 7 minutes.

