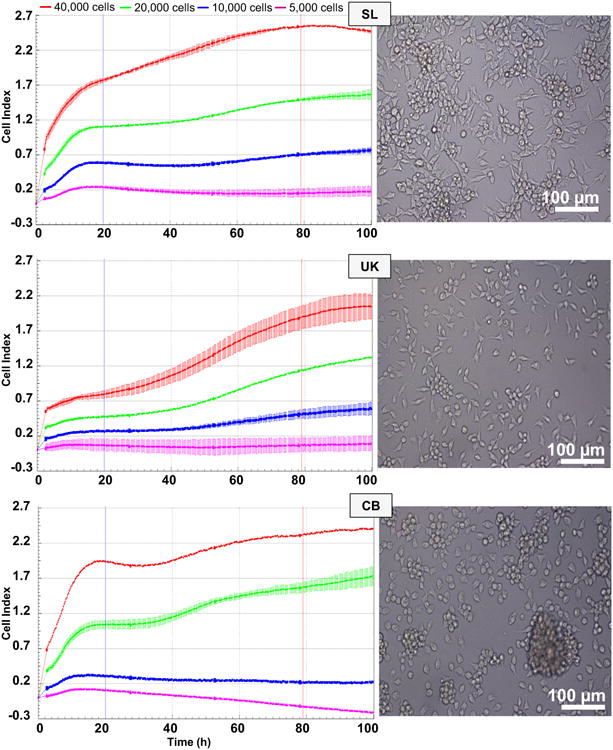
Fig. 1.

Cytometric analysis of the three Bge (Biomphalaria glabrata embryonic) cell isolates. Cellular proliferation of Bge cell isolates SL, UK and CB measured in real time by xCELLigence. The time interval employed to estimate the doubling times is indicated by the vertical bars (∼20 h and ∼ 80 h). Error bars: ±1 S.D. of the mean. Representative images of Bge cell isolates SL, UK and CB. Magnification 20×, scale bars: 100 μm The number of cells seeded per well is indicated above the graphs.
