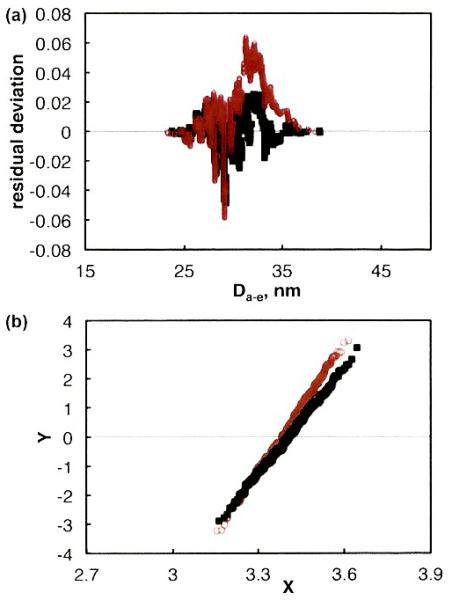
Figure 2.
Comparison of data for non-touching particles (solid black squares) and the Watershed algorithm for separation of touching particles (open red circles). Lab E, (a) comparison of residual deviations. (b) Comparison of quantile plot transforms. X and Y are defined by table 1 of ISO 9276-3 [15].

