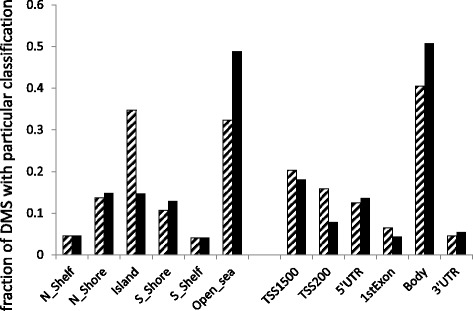
Fig. 2.

Genomic distribution of DMS between obese and never-obese women in relation to CpG content (left) and functional parts of genes (right). The genomic distribution of 5529 DMS between obese and never-obese women (black bars) (FDR 1 %) were compared to all 319,596 analyzed CpG probes (hatched bars). TSS1500; within 1500 basepairs of transcriptional start site (TSS). TSS200; within 200 basepairs of TSS
