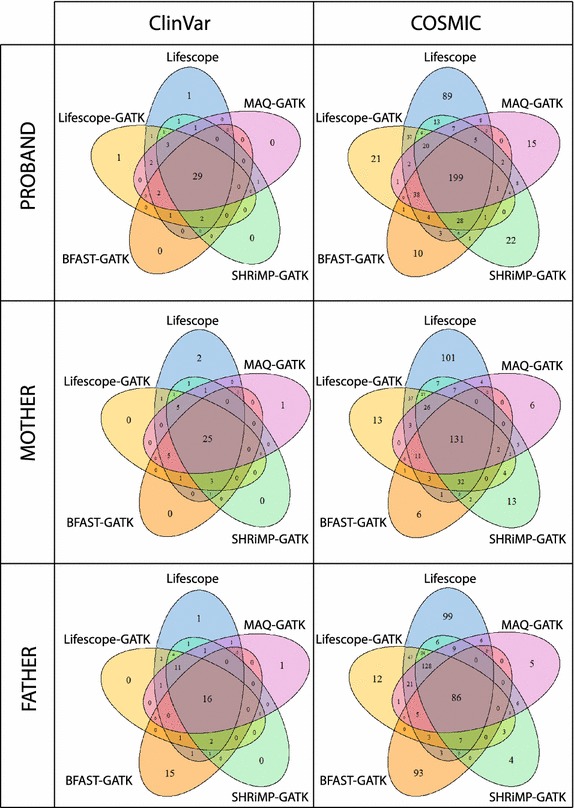
Fig. 4.

Agreement between different variant calling approaches with respect to called SNPs that are present in ClinVar and COSMIC databases. Venn diagrams show how much different approaches agree in identifying harmful variants. The middle area of each diagram shows number of variants common to all methods. The Venn diagram leafs show number of variants specific to each method. On the left are diagrams representing SNPs in ClinVar database and on the right is distribution of identified SNPs present in COSMIC database. The ittop part of the figure shows diagrams of proband, the itmiddle represents mother and the bottom represents father. Substantial agreement between the methods was observed on pathogenic and drug response ClinVar variants
