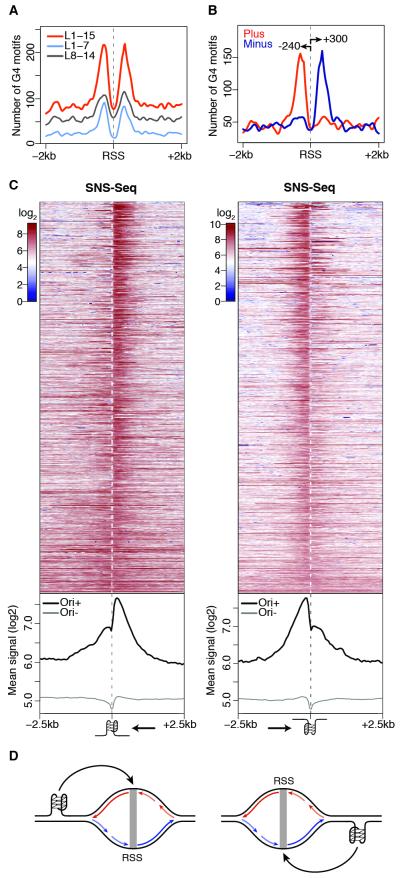
Figure 2. A G-quadruplex signature at S2 replication origins.
(A) Spatial distribution of G4 motifs within ± 2 kb of S2 RSSs. (B) Same as (A) for strand-specific annotation of G4 L1-15 motifs. Arrows indicate peak distances (bp) from the RSS. (C) S2 SNS-Seq signals within ± 2.5 kb of origin-associated G4 L1-15 motifs occurring on the plus (left) and minus (right) strands, ranked by coefficient of variation. Bottom panels show the average of the signals above (Ori+) and at origin-negative (Ori−) G4 motifs. Arrows indicate the direction of the leading strand facing the G4. (D) Model describing how origin-proximal G4 motifs could orient (black arrows) replication forks. Leading strands (long arrows) and Okazaki fragments (short) replicating the plus (red) and minus (blue) strands are indicated. See also Figure S2.

