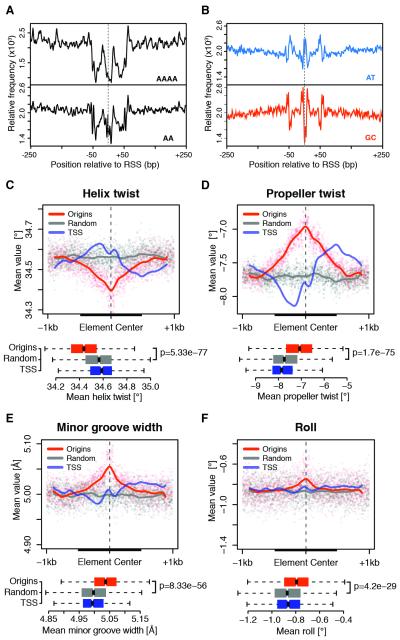
Figure 4. Specific DNA shape features mark metazoan replication origins.
(A) Relative frequency of AAAA polynucleotides and AA dinucleotides within ± 250 bp of S2 RSSs. (B) Same as (A) for AT and GC dinucleotides. (C-F) Average of DNA shape features within ± 1 kb of RSSs for constitutive Drosophila origins, background regions and TSSs. The latter were extended while preserving orientation. Solid lines are Loess fitted curves from single-nucleotide resolution shape predictions (dots). Boxplots of average feature values within 500 bp windows (thick black lines) are shown (bottom panels). p-values are from Wilcoxon rank-sum test. See also Figure S4.

