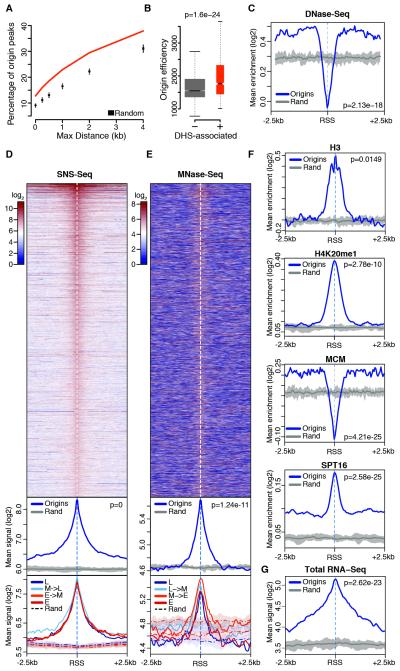
Figure 5. The chromatin composition of Drosophila replication origins.
(A) Percentage overlap of S2 origin peaks with DHSs and random expectation. (B) Efficiency of S2 origins localizing within (+) or outside (−) DHSs. (C) Average DNase-Seq enrichment within ± 2.5 kb of S2 RSSs and within ten sets of randomized genomic regions (Rand). The thick gray line traces average background values. (D) Spatial distribution of SNS-Seq signal within ± 2.5 kb of S2 RSSs (top), metaprofiles comparing origins with ten sets of randomized genomic regions (middle), and further partitioning of the signal above in four timing classes (L: late S-phase; M: mid; E: early) based on replication timing quartiles (bottom). (E) Same as (D) for MNase-Seq. (F-G) Same as (C) for the indicated features. p-values are from Wilcoxon rank-sum test. See also Figure S5.

