Figure 1.
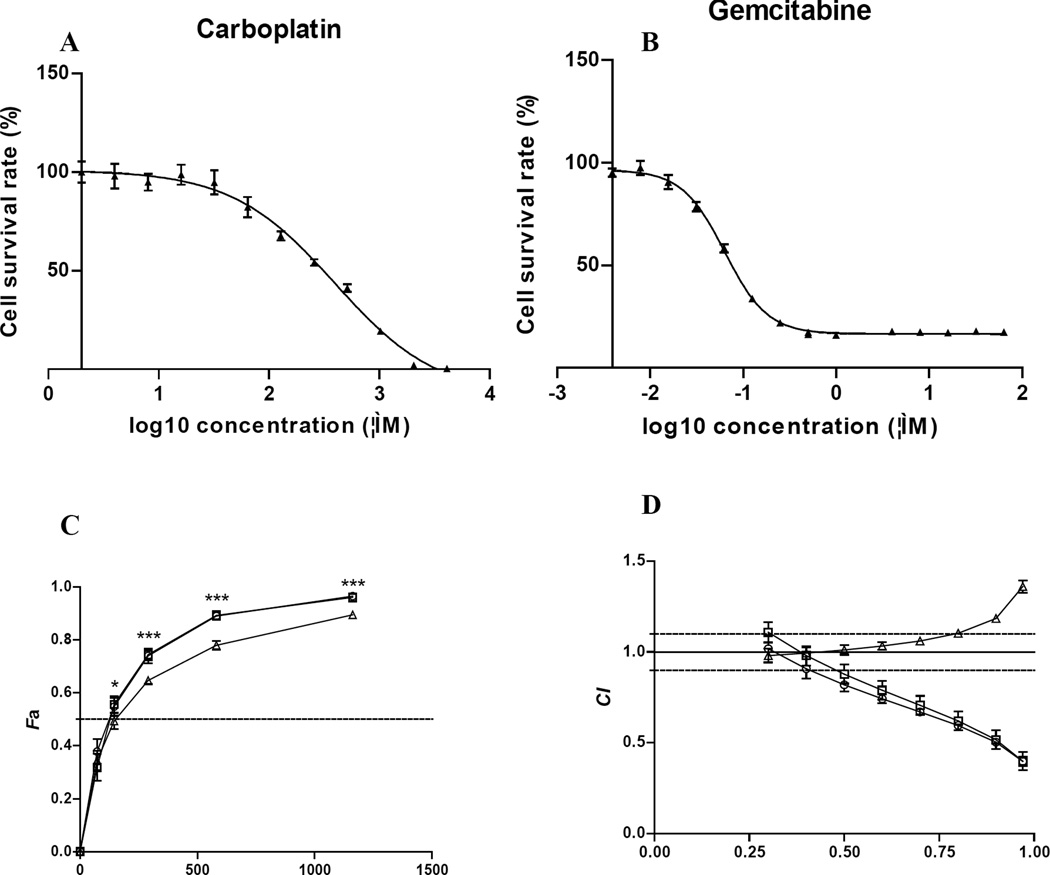
The anti-tumor activity of carboplatin, gemcitabine or in combination. A and B: Dose-dependent cytotoxic effects of 5637 cells exposed to carboplatin (A) or gemcitabine (B). C. Dose-effect curves for the carboplatin/gemcitabine combinations. 5637 cells were treated with: gemcitabine for 4 h followed by carboplatin for 4 h (square); carboplatin for 0.5 h followed by carboplatin plus gemcitabine for 3.5 h (circle); carboplatin for 4 h followed by gemcitabine for 4 h (triangle). Data are means ± SD of three independent experiments (each with samples in triplicate). *p<0.05, ***p<0.001. D. CI Plot. CI values are plotted as a function of the fractional inhibition (Fa) from 0.10 to 0.97. The CI values of <0.9 (below the lower dash line), =0.9–1.1, and <1.1 (above the upper dash line) represent synergism, additivity and antagonism, respectively.

