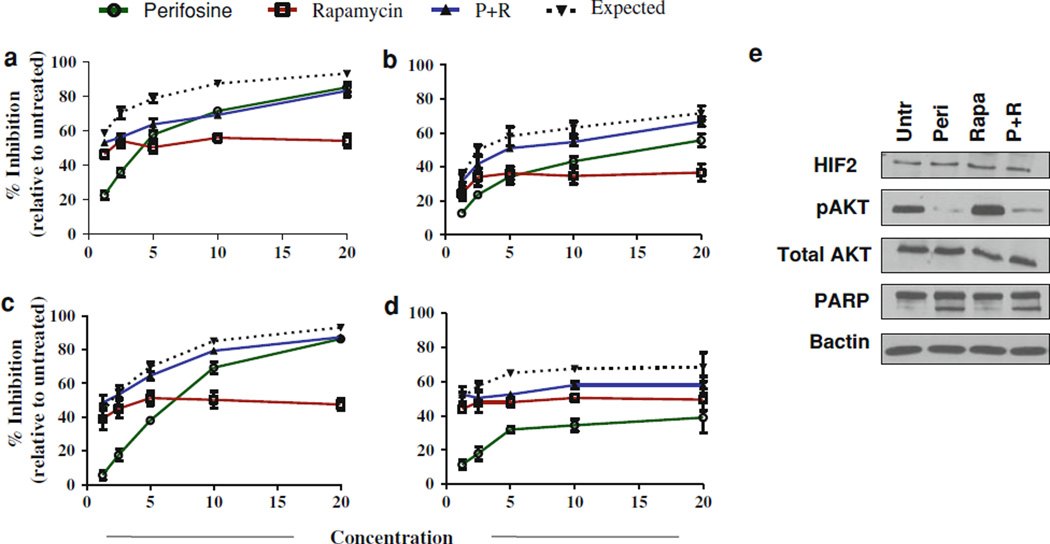
Fig. 3.
Growth curves of RCC cell lines (a) 786-O, (b) CAKI-1, (c) 769-P, and (d) A498 following 72 h of treatment with single-agent perifosine (mM), rapamycin (nM), or the combination. Data are graphed as % inhibition relative to untreated cells. The expected line is derived from the Bliss independence model and represents the expected inhibition of the combination if it showed additivity. e Protein expression of pAKT(S473) following treatment with perifosine (5 mM), rapamycin (10 nM), and the combination for 24 h in 786-O cells

