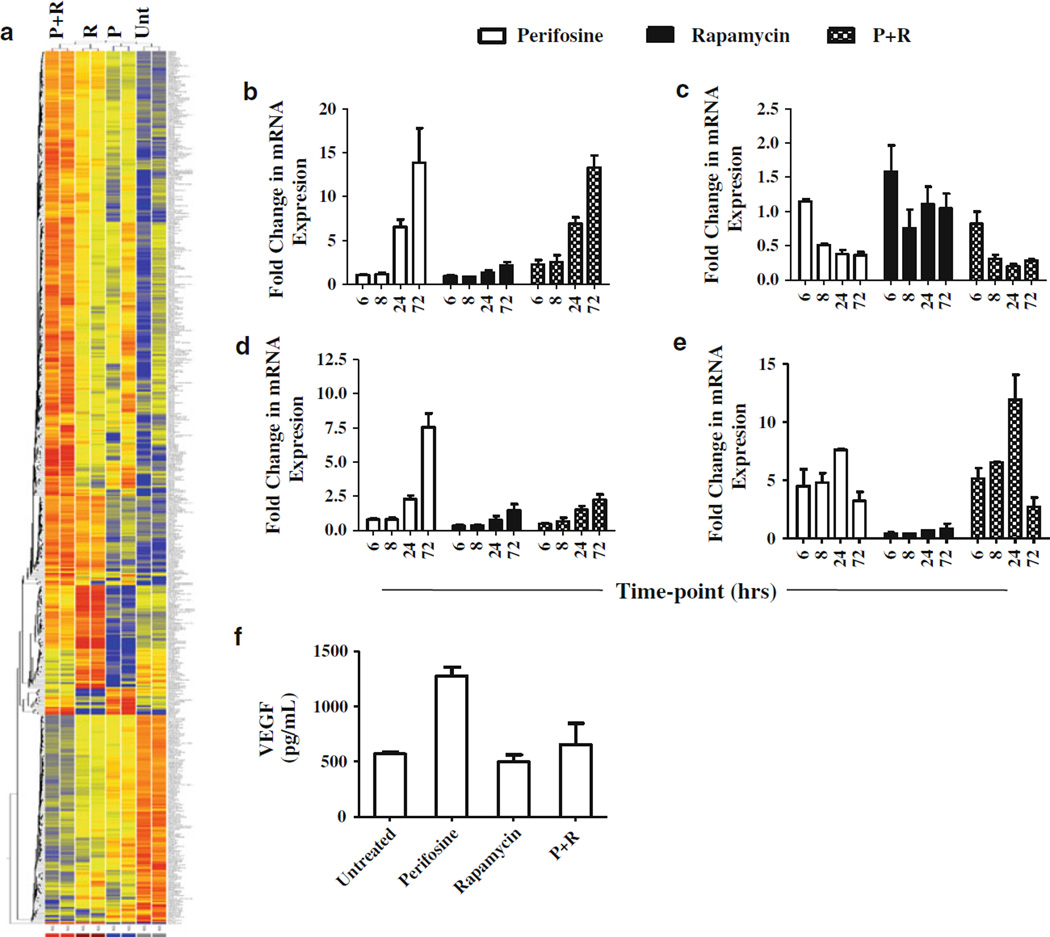
Fig. 5.
Gene expression analysis using perifosine (5 mM), rapamycin (5 nM), and the combination compared to untreated. a Heat map of gene expression obtained from Affymetrix GeneChip microarray. Represents duplicates of perifosine (P), rapamycin (R), the combination (P + R), and untreated (U) 786-O cells following 24 h of treatment. qRT-PCR validation from 786-O cells of microarray data for (b) KLF2, (c) IL-8, and (d) VEGF following a time course. e qRT-PCR of treatment time course in CAKI-1 for KLF2. Fold change is relative to untreated. f Concentration of secreted VEGF-A following 72h of treatment

