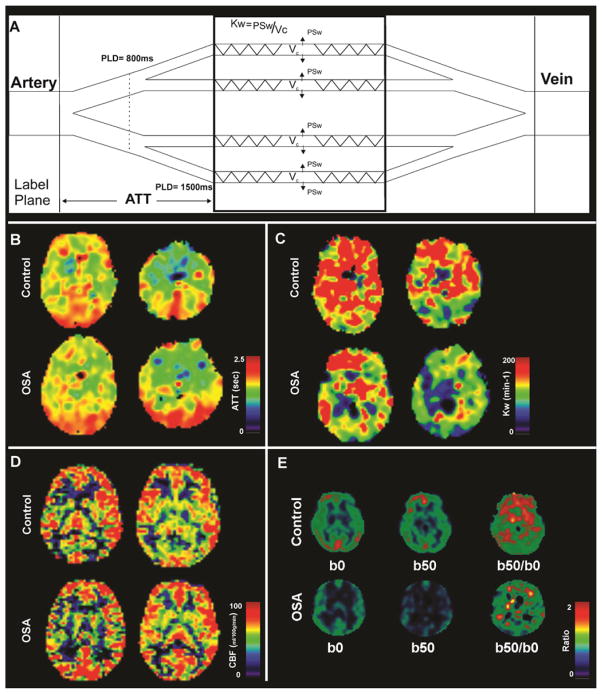
Figure 1.
Diagram of ATT and Kw measures, ATT, Kw, CBF maps, and DW-pCASL images and ratio maps from one control and one OSA subject. Figure (A) shows a diagram for the proposed two-stage ATT and Kw measurements. In stage one, a shorter PLD of 800 ms and a lower b value 10 s/mm2 are used to differentiate labeled water in large and small arteries in order to estimate ATT; In stage two, a longer PLD of 1500 ms and a higher b value 50 s/mm2 are used to differentiate labeled water in capillaries and brain tissue in order to estimate Kw (details see St Lawrence et al MRM 2012). Multiple brain sites in OSA subject show comparable ATT (B) and CBF (D) values, and reduced Kw (C) and DW-pCASL ratio (E) values compared to control subject (sites with hot vs. cool color).

