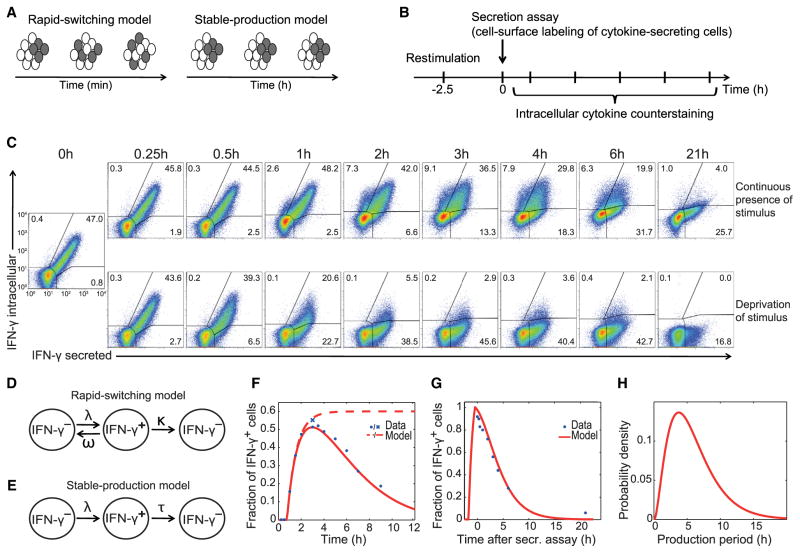
Figure 1. Individual Th Cells Maintain Their Specific Rate of Cytokine Production.
(A) Alternative models of cytokine production by T cell populations.
(B) Experimental setup.
(C) Th1 cells were restimulated with PMA and ionomycin. Live IFN-γ+ cells were labeled by secretion assay and cultured with or without stimulus. Intracellular IFN-γ counterstainings were performed at the indicated time points. Percentages of IFN-γ+ cells are indicated.
(D) Scheme of the “rapid-switching model” that allows cells to cycle between producing and nonproducing states at rates λ and ω before production is irreversibly ceased at a rate κ.
(E) Scheme of the “stable-production model” used to extract the IFN-γ production length distribution τ in the population. Cells become IFN-γ+ at a rate λ.
(F) Fit of the stable-production model (solid line) to the time series data of IFN-γ production (intracellular staining, dots). The brefeldin A control (cross) is modeled by leaving out the second step in the model (dashed line).
(G) Model fit (simultaneously with the data from F) to the kinetics of the secreted-IFN-γ+ cells from (C) (IFN-γ measured by intracellular staining).
(H) The resulting production period is 5.9 ± 3.6 hr (mean production period and variability within the population).
Data are representative of three independent experiments. See also Figures S1 and S2.

