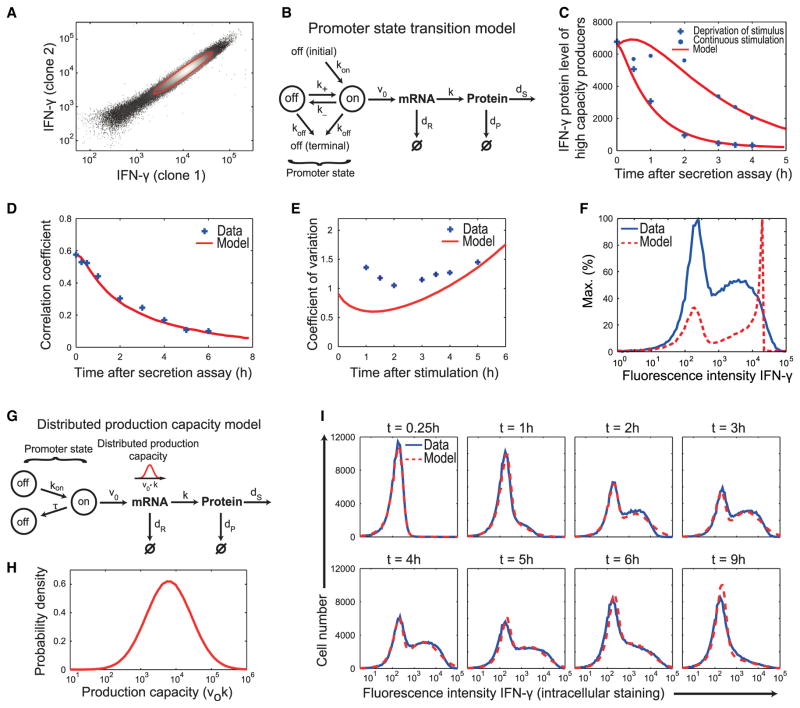
Figure 2. Mathematical Modeling Predicts Inherently Distinct Cytokine Expression Capacities of Individual Cells.
(A) Intracellular IFN-γ detection with two different antibodies. The red line represents the one standard deviation error ellipse of the IFN-γ+ cells corresponding to a relative measurement error of 17%.
(B) Scheme of the “promoter state transition model:” Cytokine transcription becomes active with rate kon after stimulation and is terminally inactivated with rate koff; intermittently, the promoter can switch between transcriptional on and off states (transcriptional bursting, k±). Transcription, translation, degradation of IFN-γ mRNA and protein, and protein secretion are described with rate constants v0, k, dR, dP, and dS.
(C) Decline of the mean protein amount in IFN-γ+ cells with persistent stimulus (dots) and after removal of the stimulus (crosses) (cf. Figure 1C) together with fits of the model in (B) (solid lines).
(D) Correlation coefficients (crosses) calculated for the secreted-IFN-γ+ cells and fit of the model (solid line).
(E) Coefficients of variation of the distributions of IFN-γ+ cells (crosses) and simulation of the model substantially deviating from the data (solid line).
The experimental data in (C)–(E) were used simultaneously for fitting the model parameters.
(F) Intracellular IFN-γ staining of Th1 cells 3 hr after restimulation (blue) and simulation of the promoter state transition model (red).
(G) Scheme of the “distributed production capacity model:” As in (B) but allowing only for a single switch-on and switch-off event: The promoter switches to an on-state at a rate kon and switches back to a nonproductive state after a gamma-distributed production period τ. The IFN-γ expression capacity, defined as the product of transcription and translation rates, v0 k, is assumed to be lognormally distributed within the cell population.
(H) Lognormal distribution of the IFN-γ production capacity (v0 k) resulting from the fit in (I).
(I) Fit of the model (dashed line) to the time evolution of the distribution of intracellular IFN-γ amounts within the total Th1 cell population (solid line).
Data are representative of three independent experiments. See also Figure S3.

